This section compares the different ways grouped rows can be displayed in the grid.
Row Grouping performs a GROUP BY operation to the 'flat' list of rows provided to the grid, where the rows are grouped by one or more columns. The Display Types listed below are only concerned with how the results of Row Grouping are displayed in the grid.
If the rows supplied to the grid do not need to be grouped by the grid, consider using Tree Data instead.
Single Group Column
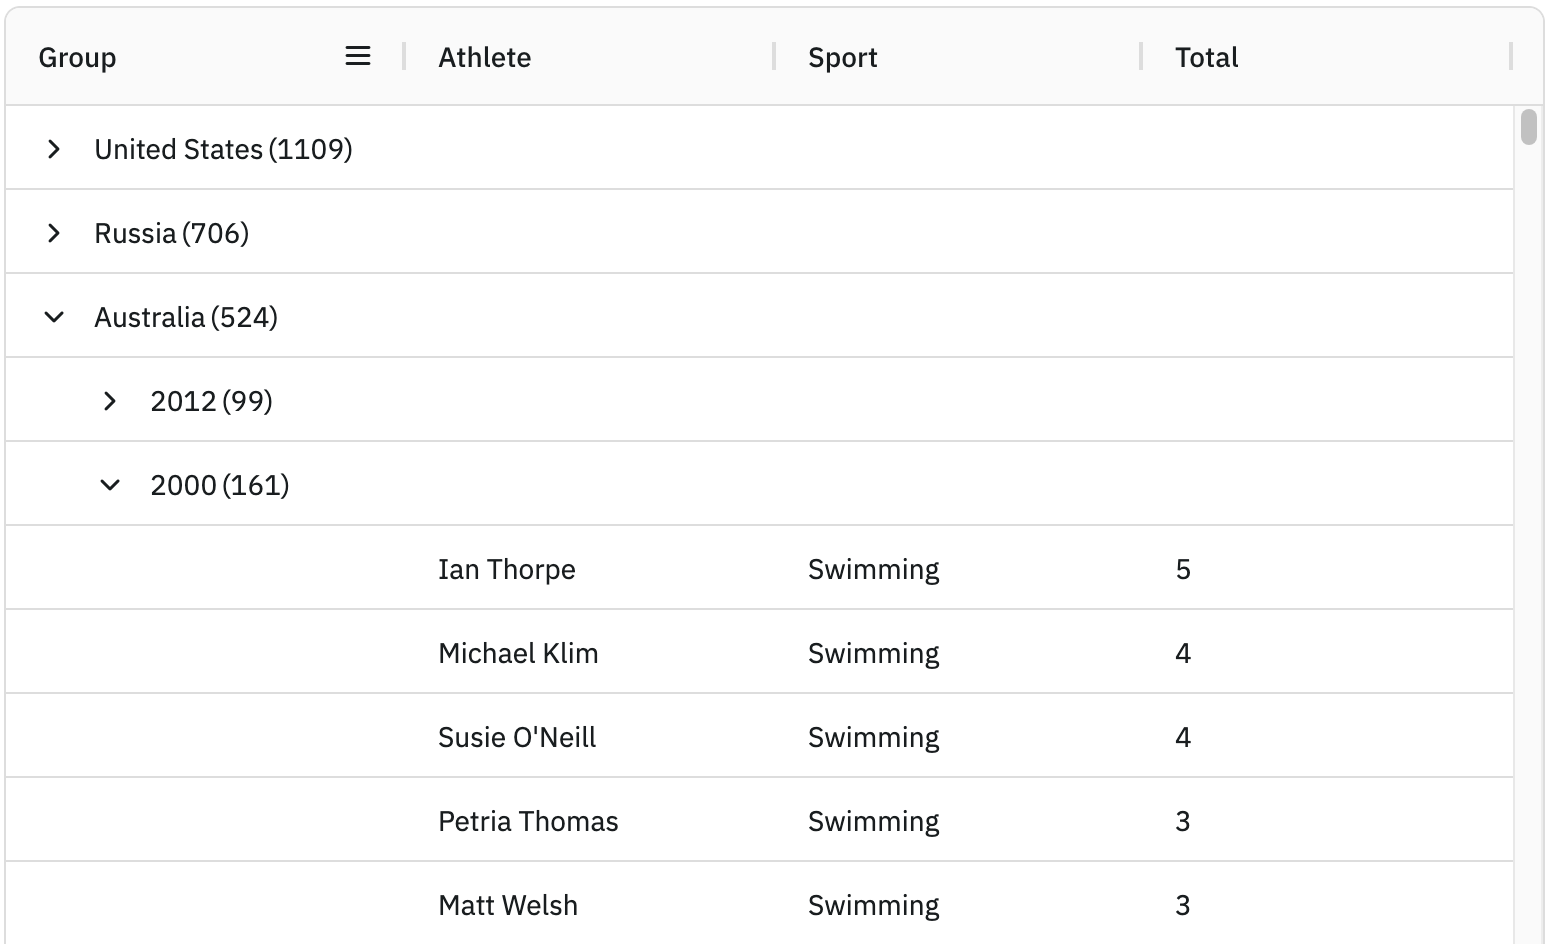
A single group column is added to the grid which displays all row groups.

As illustrated above, there is a single group column containing the country and year row groups in a single group hierarchy.
See the Single Group Column section for more details.
Multiple Group Columns
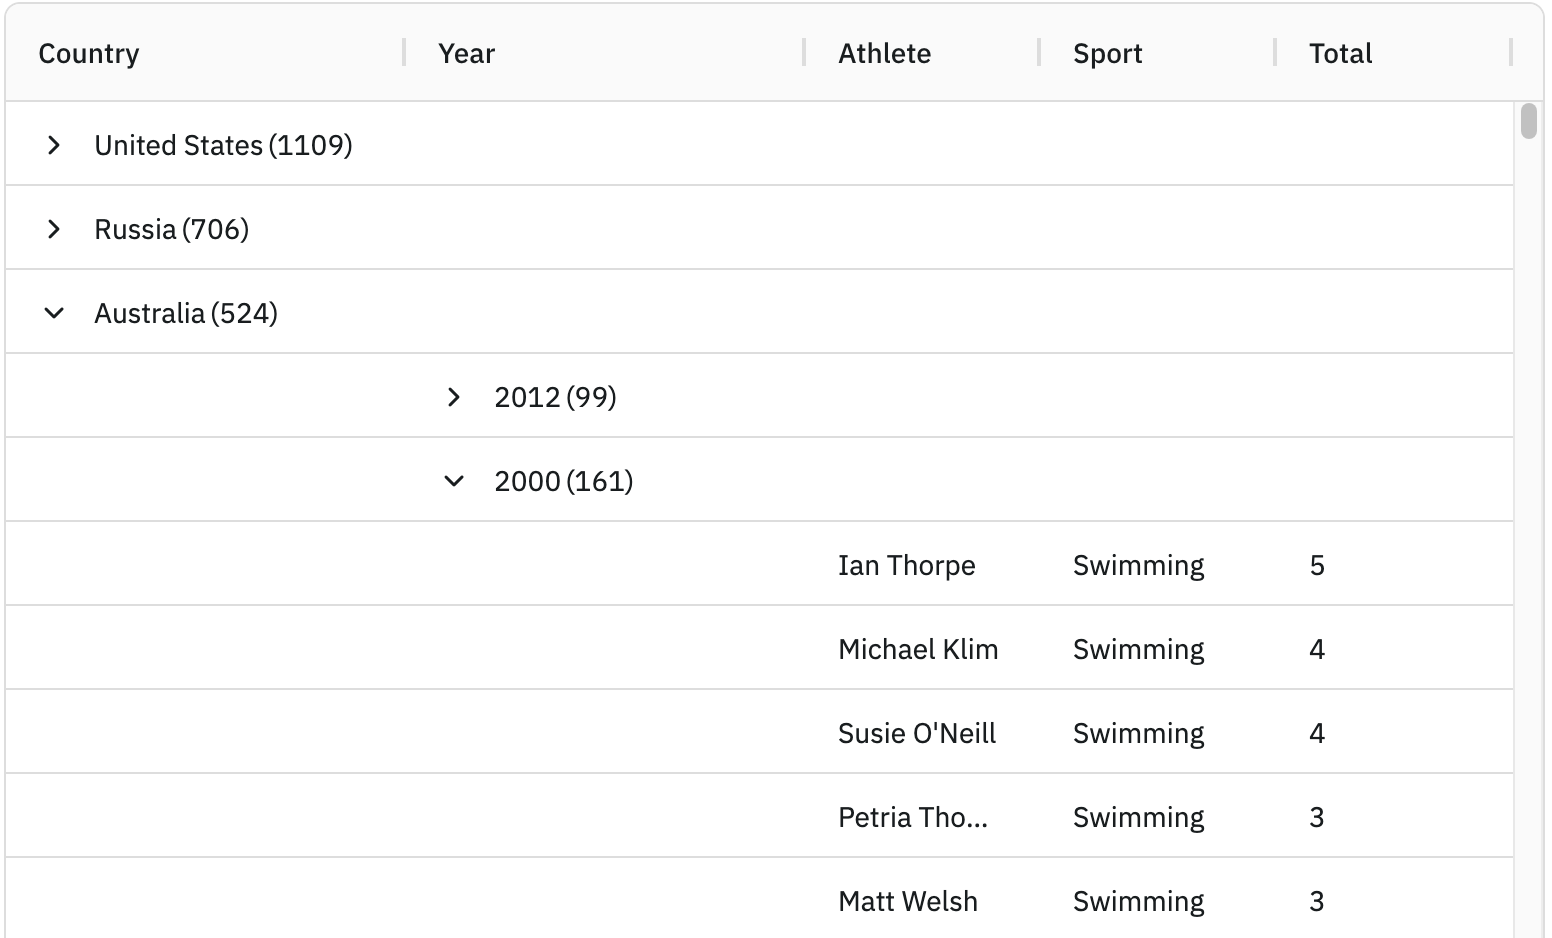
Separate group columns will be added to the grid for each column used to group the rows by.

As illustrated above, the country and year row groups are displayed under separate group columns.
See the Multiple Group Columns section for more details.
Group Rows
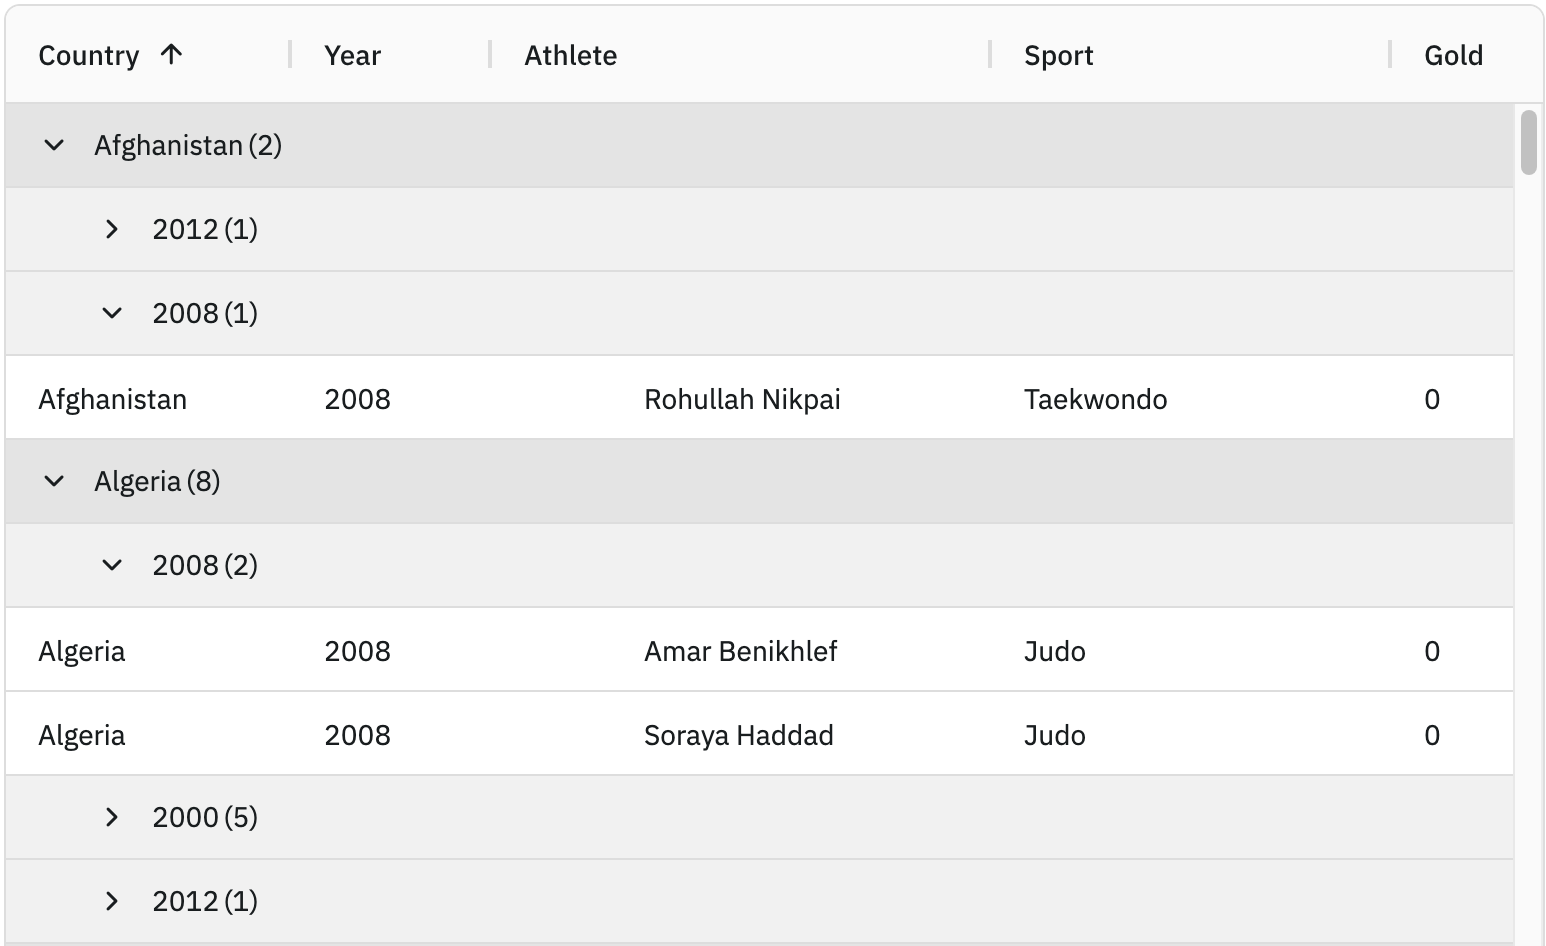
No group columns are added to the grid, instead row groups are displayed using group rows.

As illustrated above, the country and year row groups are displayed using Group Rows.
See the Group Rows section for more details.
Custom Group Columns
In some rare cases it may be desirable to supply your own custom groups rather than using the provided display types above.
See the Custom Group Columns section for more details.
Next Up
Continue to the next section to learn about the Single Group Column display type.