Server-side operations with Java & Spark
Learn how to perform server-side operations using Apache Spark with a complete reference implementation.
In recent years analysts and data scientists are requesting browser based applications for big data analytics. This data is often widely dispersed in different systems and large file storage volumes.
This guide will show how to combine Apache Spark's powerful server side transformations with ag-Grid's Server-side Row Model to create interactive reports for big data analytics.
We will develop an Olympic Medals application that demonstrates how data can be lazy-loaded as required, even when performing group, filter, sort and pivot operations.
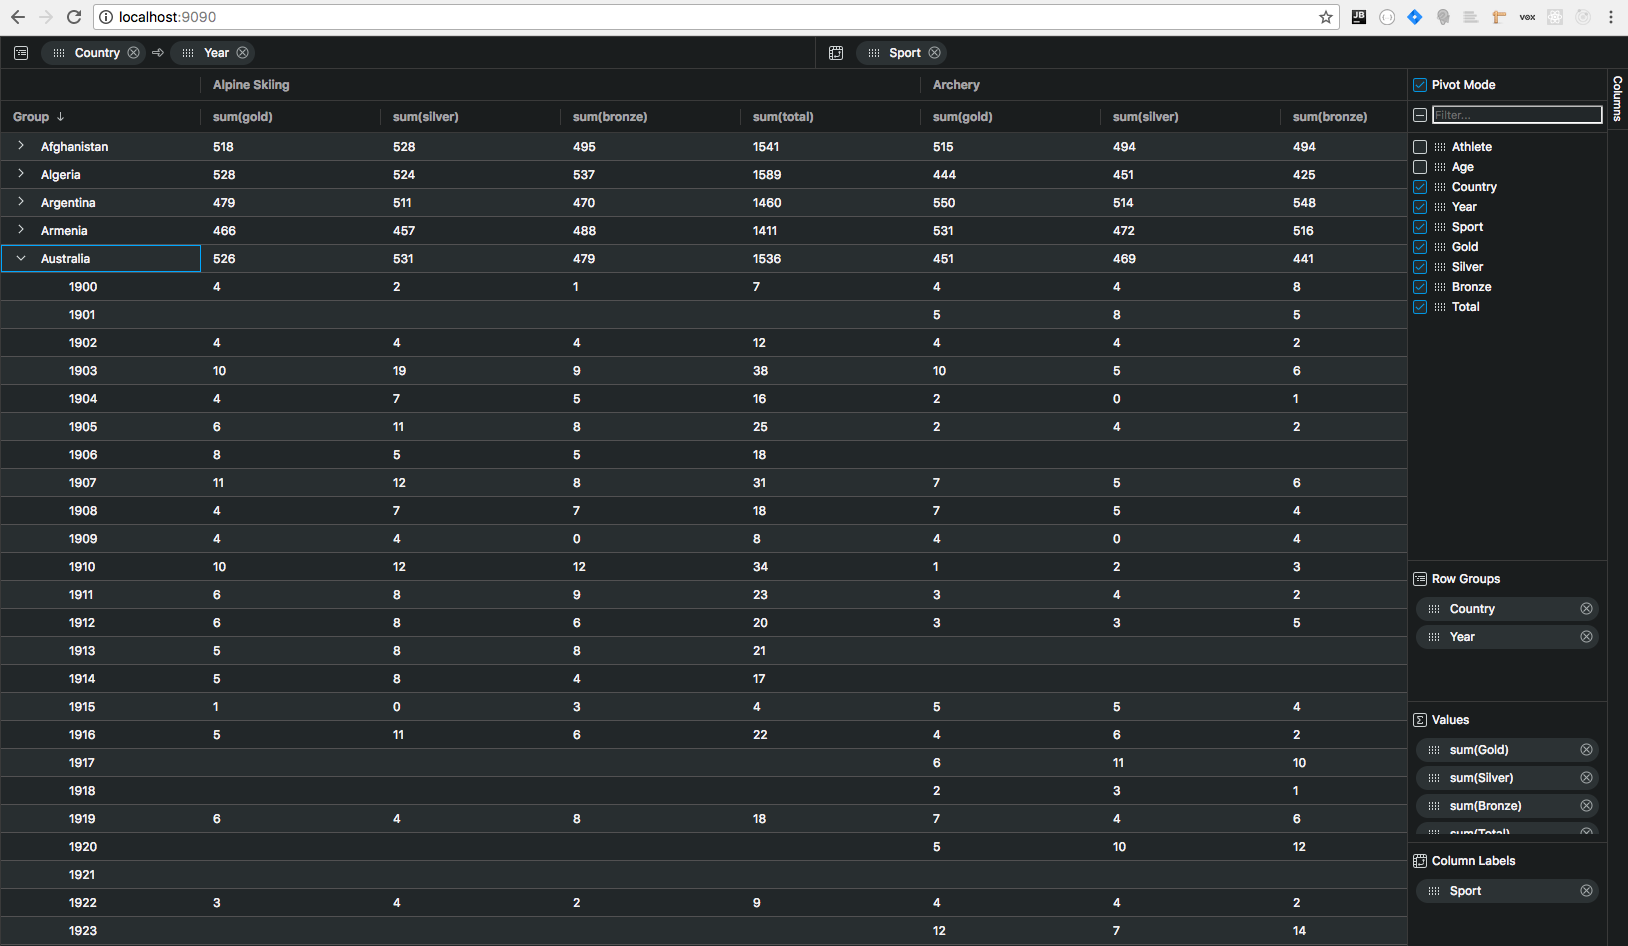
The source code can be found here: ag-grid-server-side-apache-spark-example
Overview
Apache Spark has quickly become a popular choice for iterative data processing and reporting in a big data context. This is largely due to it's ability to cache distributed datasets in memory for faster execution times.
DataFrames
The Apache Spark SQL library contains a distributed collection called a DataFrame which represents data as a table with rows and named columns. It's distributed nature means large datasets can span many computers to increase storage and parallel execution.
In our example we will create a DataFrame from a single csv file and cache it in memory for successive transformations. In real world applications data will typically be sourced from many input systems and files.
Transformations
With our application data loaded into a DataFrame we can then use API calls to perform data transformations. It's important to note that transformations just specify the processing that will occur when triggered by an action such as count or collect.
The following diagram illustrates the pipeline of transformations we will be performing in our application:
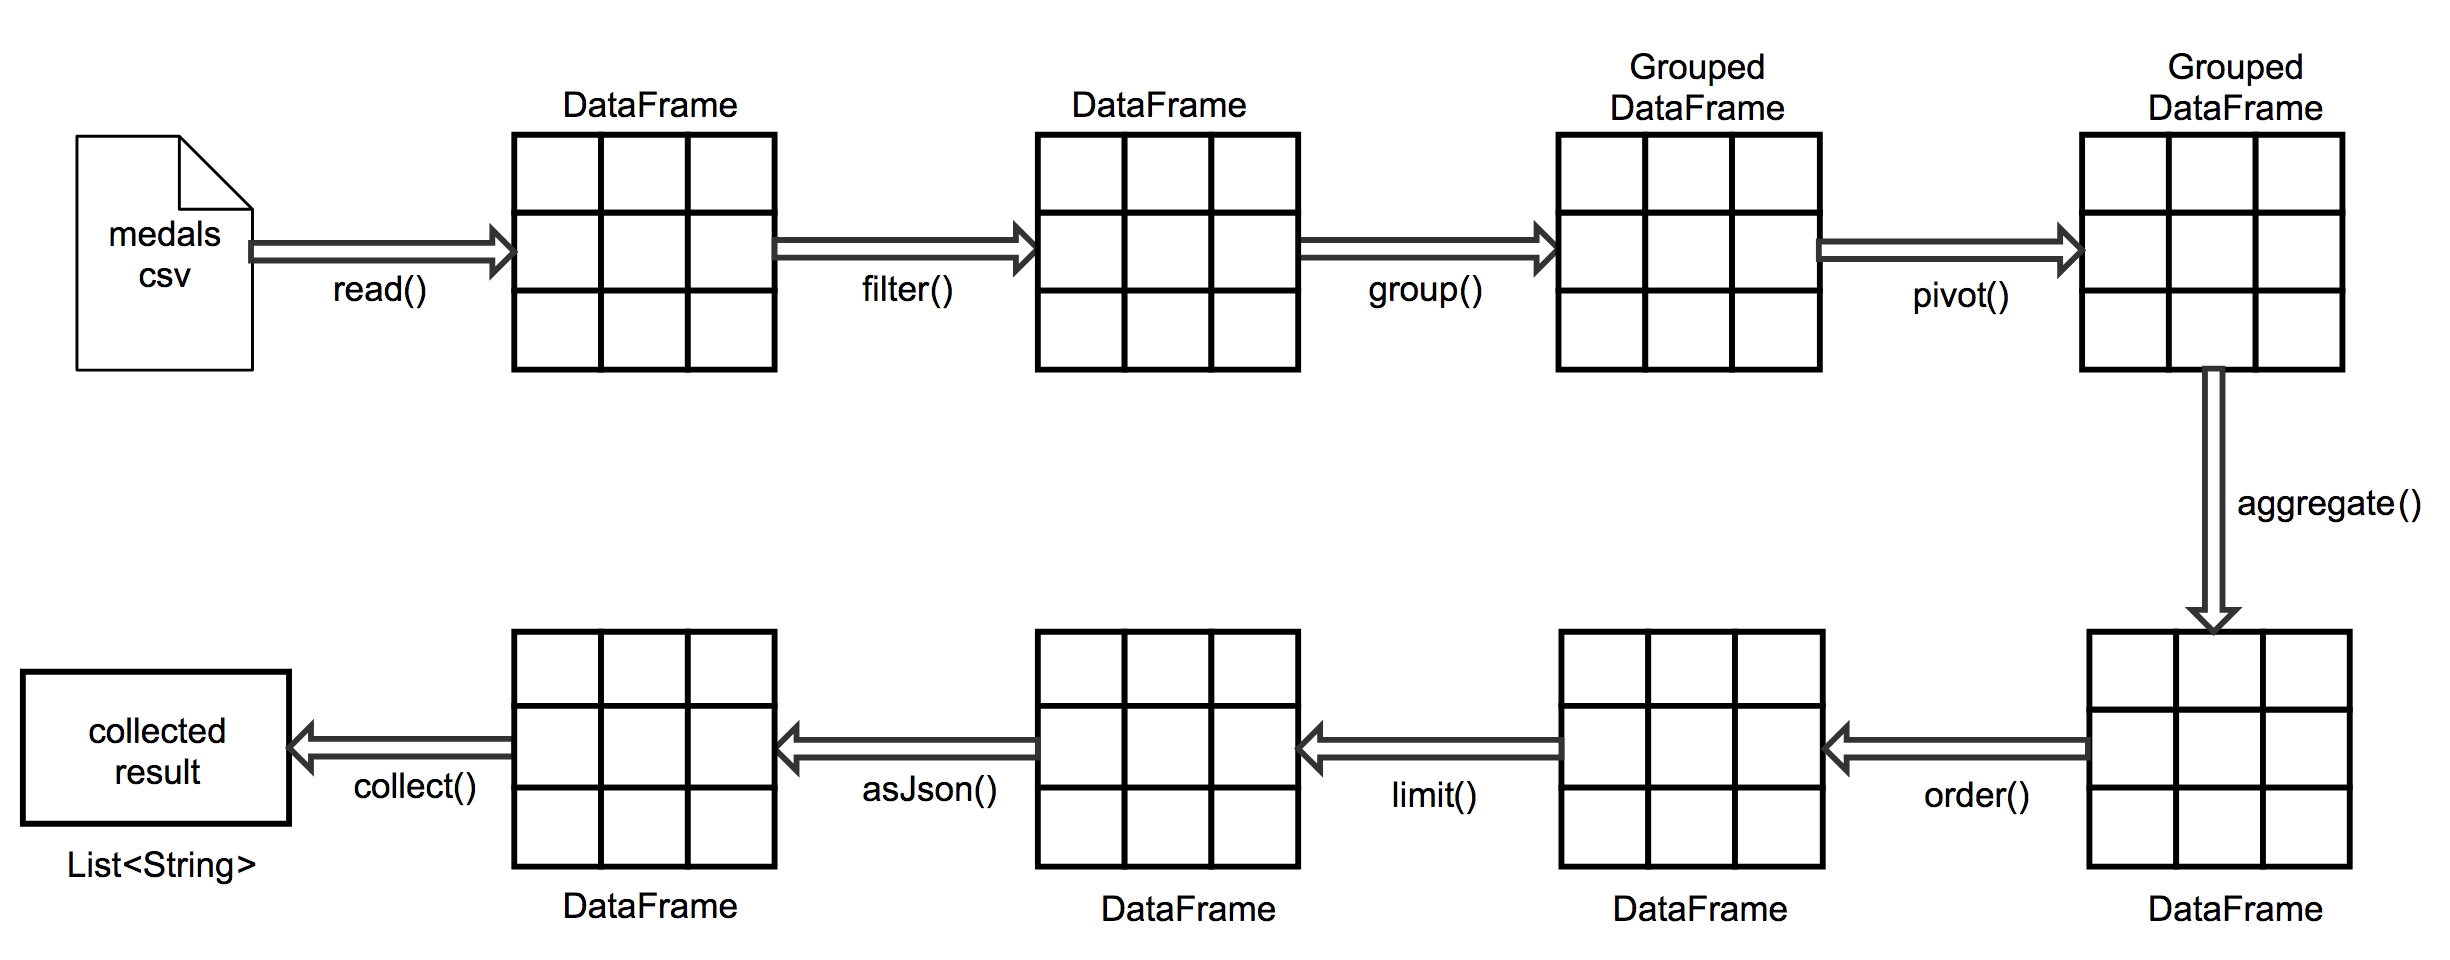
Each of these individual transformations will be described in detail throughout this guide.
Before preceding with this guide be sure to review the Row Model Overview as it provides some context for choosing the Server-side Row Model for big data applications.
Prerequisites
It is assumed the reader is already familiar with Java, Maven, Spring Boot and Apache Spark.
This example was tested using the following versions:
- ag-grid-enterprise (v18.0.0)
- Java(TM) SE Runtime Environment (build 1.8.0_162-b12)
- Java HotSpot(TM) 64-Bit Server VM (build 25.162-b12, mixed mode)
- Apache Maven (3.5.2)
- Apache Spark Core 2.11(v2.2.1)
- Apache Spark SQL 2.11(v2.2.1)
Download and Install
Clone the example project using:
To confirm all went well you should see the following maven output:
Spark Configuration
The example application is configured to run in local mode as shown below:
By default the spark.sql.shuffle.partitions is set to 200. This will result in performance degradation
when in local mode. It has been arbitrarily set to 2 partitions, however when in cluster mode this should be
increased to enable parallelism and prevent out of memory exceptions.
Setup Data
The project includes a small dataset contained within the following csv file:
src/main/resources/data/result.csv
The OlympicMedalDataLoader utility has been provided to generate a larger dataset however:
When executed it will append an additional 10 million records to results.csv, however you can modify
this by changing the BATCH_SIZE.
Run the App
From the project root run: mvn spring-boot:run
If successful you should see something like this:

To test the application point your browser to: localhost:9090
Server-side Get Rows Request
Our Java service will use the following request:
We will discuss this in detail throughout this guide, however for more details see: Server-side Datasource.
Service Controller
Our service shall contain a single endpoint /getRows with accepts the request defined above:
The OlympicMedalsController makes use of the
Spring Controller
to handle HTTP and JSON Serialization.
Data Access
The OlympicMedalDao contains most of the application code. It interacts directly with Spark and
uses the API's to perform the various data transformations.
Upon initialisation it creates a spark session using the configuration discussed above. It then reads in the
data from result.csv to create a DataFrame which is cached for subsequent transformations.
A view containing the medals data is created using dataFrame.createOrReplaceTempView("medals").
This is lazily evaluated but the backing dataset has been previously cached using: dataFrame.cache().
As a DataFrame is a structured collection we have supplied the inferSchema=true option to allow
Spark to infer the schema using the first few rows contained in result.csv.
The rest of this class will be discussed in the remaining sections.
Filtering
Our example will make use of the grids NumberFilter and SetFilter
Column Filter's. The corresponding server side classes are as follows:
These filters are supplied per column in the ServerSideGetRowsRequest via the following property:
As these filters differ in structure it is necessary to perform some specialised deserialization using the Type Annotations provided by the Jackson Annotations project.
When the filterModel property is deserialized, we will need to select the appropriate concrete
ColumnFilter as shown below:
Here we are using the filterType property to determine which concrete filter class needs to be
associated with the ColumnFilter entries in the filterModel map.
The filters are supplied to the DataFrame using standard SQL syntax as shown below:
Grouping
Grouping is performed using Dataset.groupBy() as shown below:
The result of a groupBy() transformation is a RelationalGroupedDataset collection. This
is supplied to the pivot and agg functions.
Pivoting
Spark SQL provides a convenient pivot function to create pivot tables, however as it currently only supports
pivots on a single column our example will only allow pivoting on the sport column. This is enabled on the
ColDef.enablePivot=true in the client code.
The result of a pivot() transformation is also a RelationalGroupedDataset.
From the DataFrame we will use the inferred schema to determine the generated secondary columns:
These will need to be returned to the grid in the following property:
Our client code will then use these secondary column field to generate the corresponding ColDef's like so:
In order for the grid to show these newly created columns an explicit api call is required:
Aggregation
Aggregations are performed using RelationalGroupedDataset.agg() as shown below:
Note that our example only requires the sum() aggregation function.
Sorting
The ServerSideGetRowsRequest contains the following attribute to determine which columns to sort by:
The SortModel contains the colId (i.e. 'athlete') and the sort type (i.e. 'asc')
The Dataset.orderBy() function accepts an array of Spark Column objects that specify
the sort order as shown below:
Infinite Scrolling
The ServerSideGetRowsRequest contains the following attributes to determine the range to return:
The OlympicMedalsService uses this information when limiting the results.
As Spark SQL doesn't provide LIMIT OFFSET capabilities like most SQL databases, we will need to do
a bit of work in order to efficiently limit the results whilst ensuring we don't exceed local memory.
The strategy used in the code below is to convert the supplied Data Frame into a Resilient Distributed Dataset
(RDD) in order to introduce a row index using zipWithIndex(). The row index can then be used to
filter the rows according to the requested range.
The RDD is then converted back into a Data Frame using the original schema previously stored. Once the rows have been filtered we can then safely collect the reduced results as a list of JSON objects. This ensures we don't run out of memory by bringing back all the results.
Finally we determine the lastRow and retrieve the secondary columns which contain will be required
by the client code to generate ColDefs when in pivot mode.
Conclusion
In this guide we presented a reference implementation for integrating the Server-side Row Model with a Java service connected to Apache Spark. This included all necessary configuration and install instructions.
A high level overview was given to illustrate how the distributed DataFrame is transformed in the example application before providing details of how to achieve the following server-side operations:
- Filtering
- Grouping
- Pivoting
- Aggregation
- Sorting
- Infinite Scrolling