Client-side Row Model
The simplest row model to use is the Client-side Row Model. This row model takes all of the data to be displayed and provides the following features inside the grid:
- Filtering
- Sorting
- Grouping*
- Aggregation*
- Pivoting*
The Client-side Row Model is the default row model for ag-Grid and used in all the examples (unless the example is explicitly demonstrating another row model). As such, the usage of the in Client-side Row Model is not explained in detail here. Please refer to the main parts of the grid documentation in how the features work with the Client-side Row Model.
How It Works
You do not need to know how the Client-side Row Model works, however it can be helpful for those who are interested.
The Client-side Row Model is responsible for working out how to display the rows inside the grid. It has a complex data structure, representing the data in different states. The states are as follows:
The following is an example to help explain each of these steps.
State 1: Row Data
The data as provided by the application. The grid never modifies this array. It just takes the rowData items from it. The examples is of three data items.
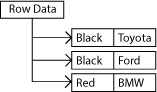
API: There is no API to get this data. However it was provided by the application so you should already have it.
State 2: All Rows
allRows is similar to rowData except a new array is created which contains row nodes, each row node
pointing to exactly one data item. The length of the allRows array is the same as the rowData array.
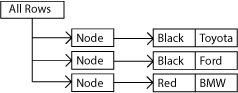
API: There is no API to get this data. However there is no benefit over the rowsAfterGroup data.
State 3: Rows After Group
rowsAfterGroup takes the allRows, and if grouping, groups the data. If no grouping is done, then rowsAfterGroup will be identical to allRows. The example shows grouping on the color field, creating two groups.
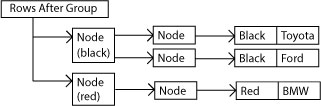
API: Use api.forEachNode() to access this structure.
State 4: Rows After Filter
rowsAfterFilter goes through rowsAfterGroup and filters the data. The example shows filtering
on the color black (thus removing the second group).
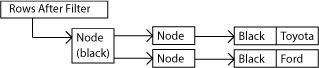
API: Use api.forEachNodeAfterFilter() to access this structure.
State 5: Rows After Sort
rowsAfterSort goes through rowsAfterFilter and sorts the data. The example shows sorting on
car make.
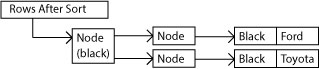
API: Use api.forEachNodeAfterFilterAndSort() to access this structure.
State 6: Rows After Map
rowsAfterMap maps the data to what should be drawn inside the grid, taking into account
what groups are open and closed. This list is what is iterated through when the grid
draws the rows. Two examples are provided below. The first when open (so three rows in
the grid, the group row plus two children), the second when closed (so one row in the
grid, the closed group).
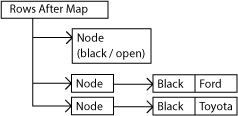
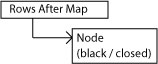
API: Use api.getModel() and then model.getVirtualRowCount() and getVirtualRow() to get the nodes.