
AG Studio is an embedded analytics component built on AG Grid and AG Charts. It lets your users build their own reports and dashboards inside your application, whilst you retain control over permissions, authentication, persistence and theming.
AG Studio 3.1 focuses on what happens after a dashboard is built: giving users a way to act on the data they see, keeping dashboards up to date as data changes and adapting them to smaller screens.
Read on for demos, code snippets, and full details on what's new.
Key features
- Drill Through - Open a detail report filtered to the item a user selected, in place, in a popup or anywhere else your application chooses, including an external page.
- Live Data - Add, update and remove rows with transactions, so widgets update in place without reloading the whole component.
- Context Menu - Show your own right-click actions, including submenus, anywhere in the dashboard: on charts, tables, pivot tables, gauges and custom widgets.
- Responsive Layout - Define alternative layouts for different screen widths, including a built-in single-column layout for mobile.
- Analyst Guide - A dedicated guide for the people building and viewing reports, separate from the developer documentation.
- Quality Improvements - New statistical chart and Multi KPI widgets, table cross-filtering, a date range slider and a range of other refinements.
Drill Through
AG Studio is incredibly effective at summarising and aggregating data, but sooner or later a user will see a number and want to know what's behind it.
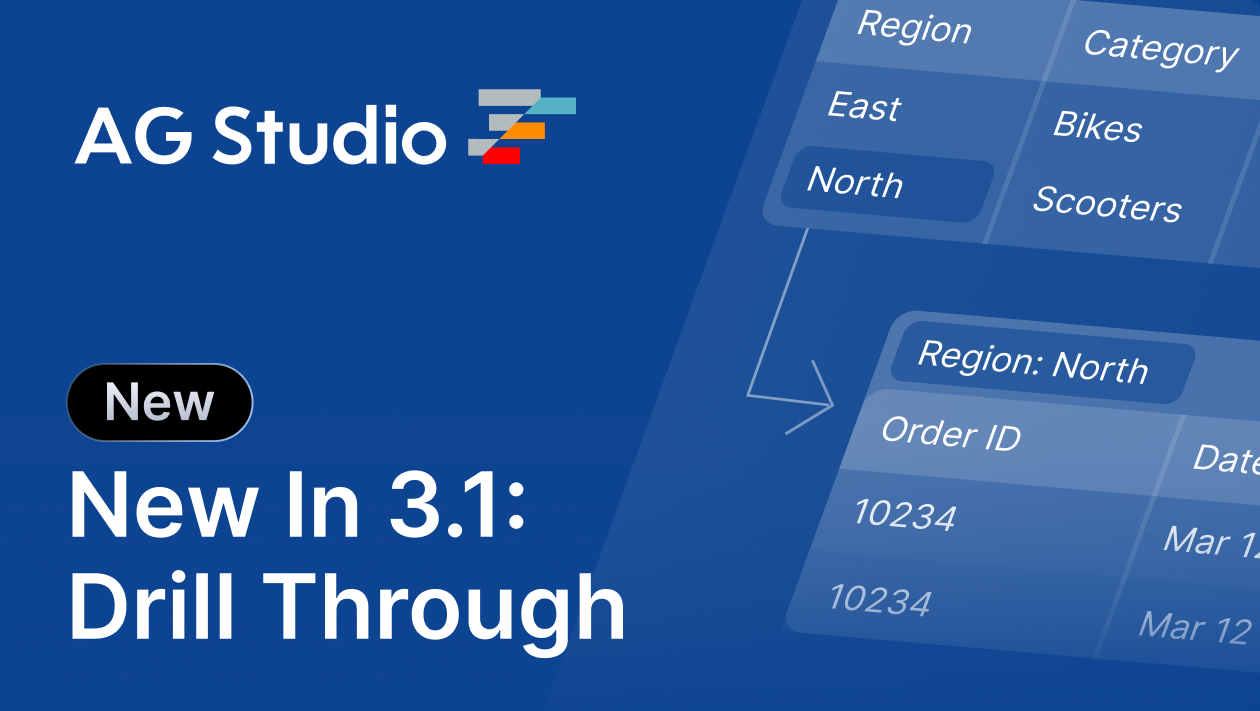
To support this, AG Studio 3.1 introduces Drill Through, which opens a detail report filtered to the item a user selected. Your application stays in control of where the detail report opens: in place, in another page of your application or in a new Studio-owned popup via api.createPopup():
Drill Through pairs naturally with the new Context Menu (covered below): when a user chooses a drill-through action from the menu, your application sets the drillThrough property with a filter, and AG Studio applies that filter to every widget in the report, showing it as a read-only card in the Filters Panel:
const studioProperties = {
  getContextMenuItems: (params) => {
    if (params.filter == null) return [];
    return [
      {
        name: 'Drill Through',
        action: () => params.api.setProperty('drillThrough', { filter: params.filter }),
      },
    ];
  },
};
Combined with the new Standalone Layout, which displays a single widget that fills the page, this makes it easy to open a focused, full-size view of the detail behind any data point.
Visit the Drill Through docs for more information.
Live Data
Dashboards built on operational data - trading positions, order books, support queues - are only useful if they reflect what's happening now.
With AG Studio 3.1, synchronous and columnar data sources can accept transactions, allowing your application to add, update and remove rows as the data changes:
To enable live data, set transactions on the data source ('none' by default): 'add' accepts new rows only, whilst 'all' also accepts updates and removals and requires a primaryKeyField. Then call applyTransaction() on the data engine:
const studioProperties = {
  data: {
    sources: [
      { id: 'trades', transactions: 'all', primaryKeyField: 'id', data: trades },
    ],
  },
};

const engine = api.getDataEngine();
await engine.applyTransaction({
  tableId: 'trades',
  add: [{ id: 3, desk: 'Credit', quantity: 10 }],
  update: [{ id: 1, desk: 'Rates', quantity: 120 }],
  remove: [2],
});
Users can also enable Highlight Changes on Table and Pivot Table widgets, which briefly shows the difference beside each updated value with an up or down arrow.
Visit the Live Data docs for more information.
Context Menu
As demonstrated in the Drill Through section, AG Studio 3.1 introduces a fully customisable Context Menu, allowing developers to expose custom functionality to users on their data points and rows:
When a user right-clicks a widget, AG Studio calls your getContextMenuItems callback and displays the items it returns, with support for separators, submenus, icons, shortcuts and disabled or checked states. The callback receives the widget that was clicked, along with the field values of the row or data point under the cursor, so your actions can respond to exactly what the user selected:
const studioProperties = {
  getContextMenuItems: (params) => [
    { name: 'Show Details', action: () => showDetails(params.filter) },
    'separator',
    {
      name: 'Copy',
      subMenu: [
        { name: 'Copy Value', action: () => copyValue() },
        { name: 'Copy Widget Type', action: () => copyWidgetType() },
      ],
    },
  ],
};
The context menu works across chart, table, pivot table and gauge widgets, and custom widgets can open it via widgetApi.showContextMenu(). It can also be opened from the keyboard with the context menu key or Shift + F10.
Visit the Context Menu docs for more information.
Responsive Layout
Users don't just work at their desks anymore - they want to consume information from anywhere, on whatever device they have available, be it a laptop, a tablet, or even their phone.
To help you meet these expectations, we've added Responsive Layouts to AG Studio 3.1, allowing you to define alternative widget layouts for different ranges of canvas width when viewing a report:
Layouts are defined via responsiveLayoutBreakpoints, and AG Studio includes a ready-made singleColumnLayout that stacks widgets in a single, full-width column, ordered by their position in the desktop layout:
import { singleColumnLayout } from 'ag-studio';

const studioProperties = {
  mode: 'view',
  // Studio's minimum width defaults to 600px - lower it for phone widths
  theme: studioTheme.withParams({ studioMinWidth: 0 }),
  layout: { minWidth: 500 },
  responsiveLayoutBreakpoints: [
    { minWidth: 500, maxWidth: 800, layout: singleColumnLayout },
  ],
};
You can also supply your own layout functions - for example, the docs include a masonry layout with two and four columns. Responsive layouts apply in view mode only, and saved state always keeps the desktop layout.
Visit the Responsive Layout docs for more information.
Analyst Guide
AG Studio is used by two very different audiences: the developers embedding it, and the analysts building and viewing reports inside their applications.
AG Studio 3.1 introduces the Analyst Guide, a dedicated home for those users with its own navigation, separate from the developer docs. It covers everything from getting started to building fully featured dashboards. We've also added new pages such as how to format values, handle missing data, and export to PDF:
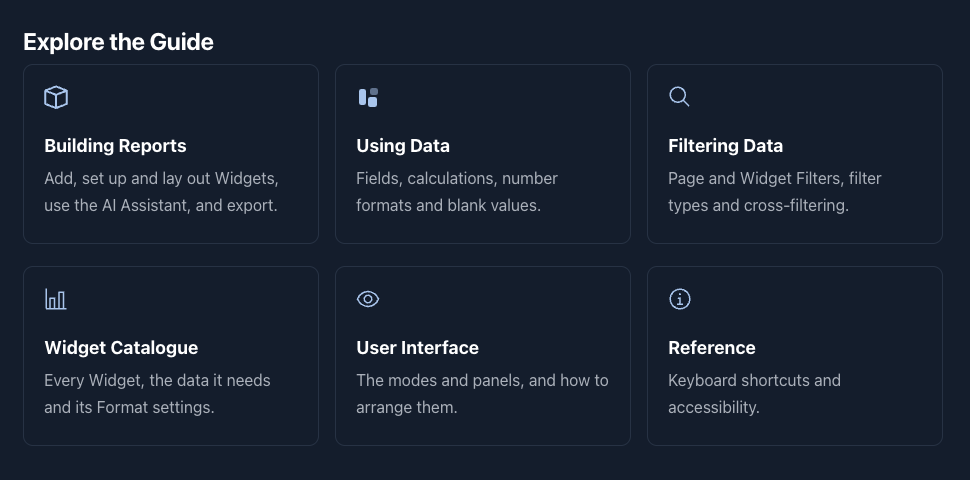
If you're embedding AG Studio in your application, the Analyst Guide is a ready-made resource you can point your own users towards.
Visit the Analyst Guide to explore it.
Quality Improvements
Alongside the new features, this release includes a range of quality improvements, including:
- New widgets: Histogram, Box Plot, Range Bar, Range Column and Range Area statistical charts, plus a Multi KPI widget that shows several headline figures in one place. The existing KPI widget also gains new label positioning and a Scale to Fit option.
- Table cross-filtering: clicking a row in a Table widget now cross-filters other widgets, and a new Click to Cross Filter option lets a widget follow cross filters without starting them.
- Date Filter range slider: a keyboard-accessible slider for “Between”, “On or After” and “On or Before” conditions.
- Data-bound Text and Image widgets: display a field's value in a Text widget, or supply a URL to an Image widget from a field.
- Restoring Undo & Redo history: pass a saved history to
initialStateso the undo stack survives a page refresh, with each change attributed to the UI, the API or an AI agent. - Linked Fields: read fields that a table doesn't display from within your cell renderers via
getLinkedValue(). - 15 new built-in locales, and a new
SWITCHexpression operator. - Data engine improvements: a wide range of correctness and performance fixes.
See the Changelog for the full list of changes in this release.
Summary
AG Studio 3.1 focuses on acting on data, keeping it current and adapting dashboards to smaller screens. This release:
- Adds Drill Through, to open filtered detail reports in place or in a popup.
- Introduces Live Data, with transactions applied via
applyTransaction()and optional highlighting of changed values. - Adds a customisable Context Menu via
getContextMenuItems. - Adds Responsive Layout via
responsiveLayoutBreakpoints, including a built-insingleColumnLayoutfor mobile. - Introduces a dedicated Analyst Guide for the people building and viewing reports.
- A range of other quality improvements, including a new statistical chart, Multi KPI widgets, table cross-filtering and more
Next steps
New to AG Studio? Visit the AG Studio documentation to get started, or request a free trial to test it in production and access our dedicated support.
We're continuing to expand AG Studio's capabilities - see our Roadmap for what's coming next, and if there's something you need that isn't on it, we want to hear about it - Enterprise customers can contact us via Zendesk; alternatively, please submit a GitHub issue or complete our contact form.
Happy coding!