

AG Charts just shipped a quadrant chart and it looks great.
We are hosting a workshop on data storytelling with David McCandless (Information is Beautiful) where the participants will visualize data using AG Studio, our dashboarding framework. I thought a quadrant chart would be a fantastic addition to the data viz lexicon for the attendees to choose from. I asked Opus 5.5 to bring it in, and 88 seconds later it was sitting in the widget menu.
Honestly, that speed is less about the model and more about how AG Studio is built: adding a chart type is a small, typed, declarative job, which is exactly what AI agents are good at.
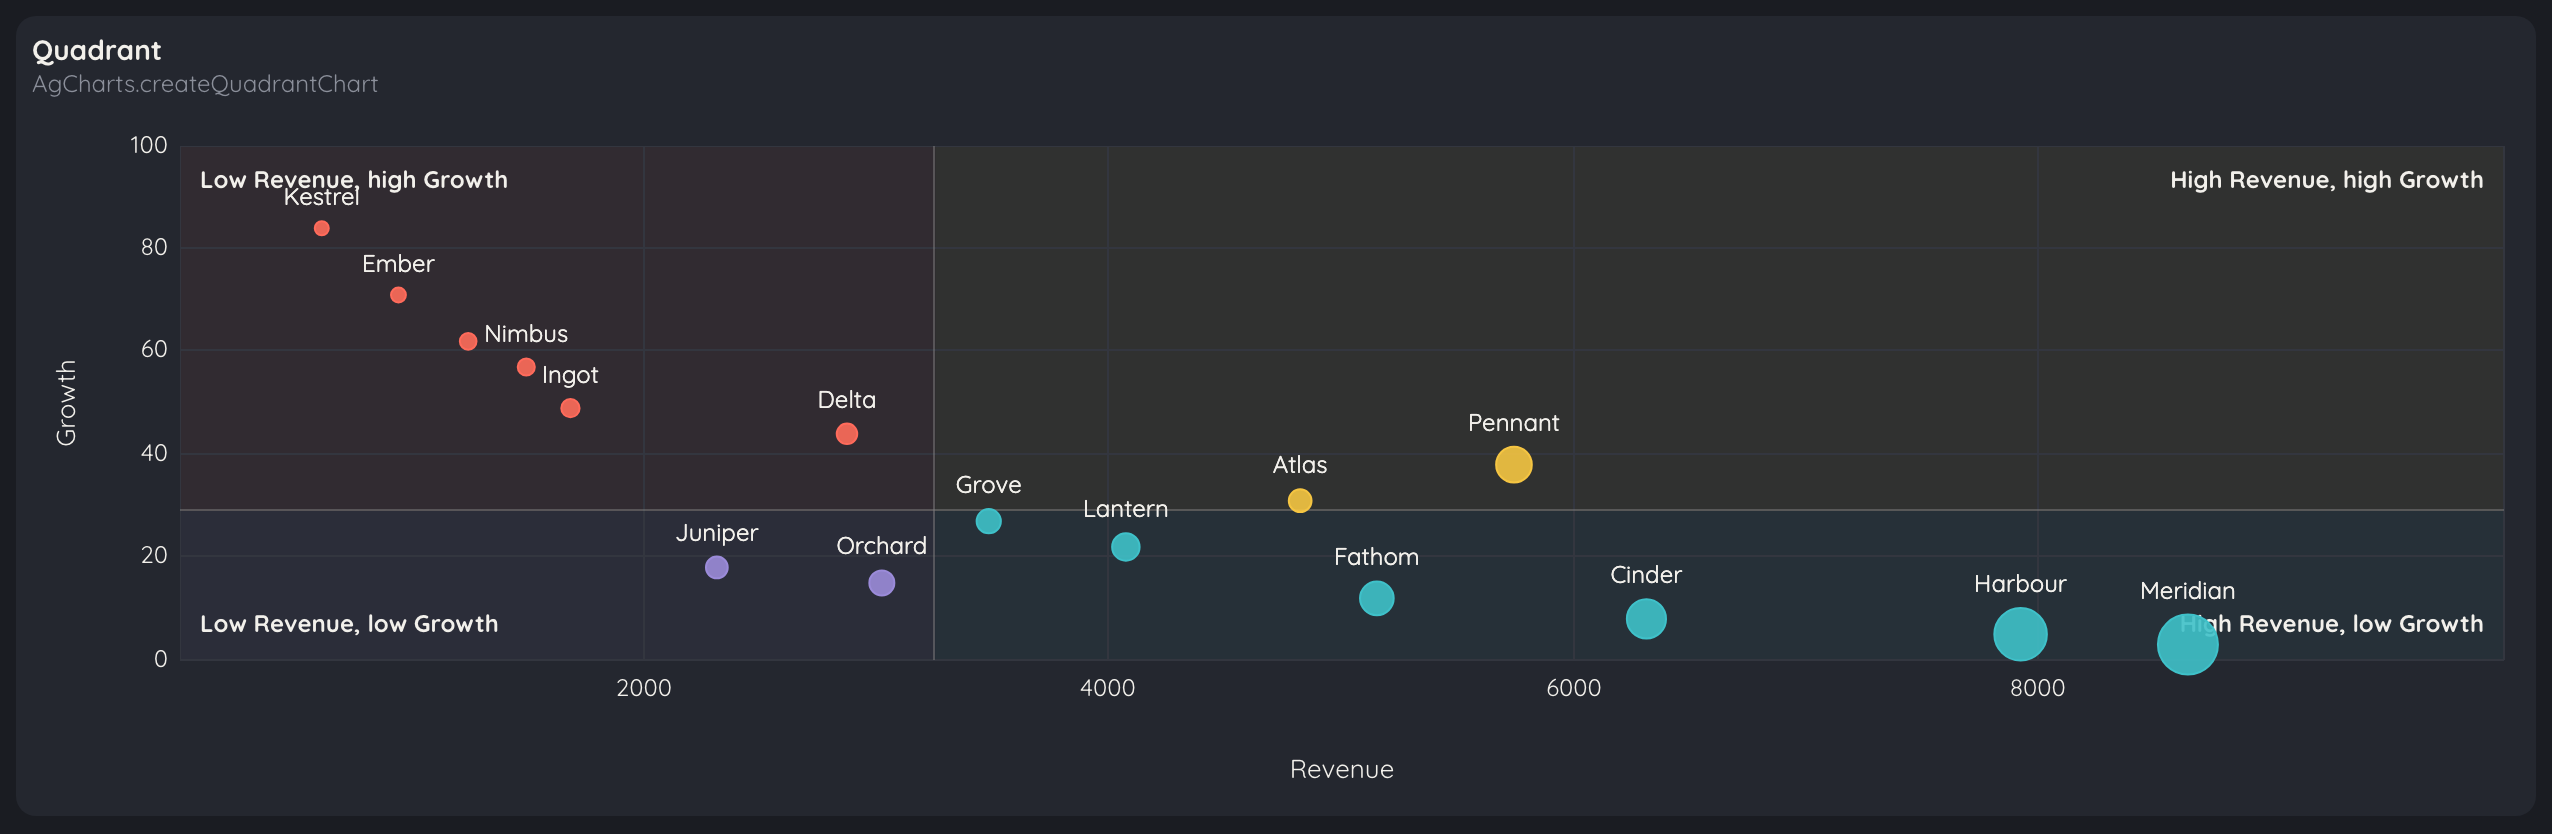
If you haven't met one yet, a quadrant chart is a scatter plot split into four named regions around a pivot. It's a brilliant way to turn a cloud of points into a story: the stars, the sleepers, the ones to watch.
AG Charts had already done the hard part, the drawing. What's left is wiring: take the fields someone picks, query the data, hand the rows to the chart. AG Studio's custom widget API keeps that wiring small. Small enough, it turns out, for one prompt.
The ask
AG Charts just released a quadrant chart. Add it to this app as a custom widget: a label, an x measure, a y measure and a bubble size. Register it in the widget menu and put an example on the gallery page.The clock
| Elapsed | What had happened |
|---|---|
| 46 s | Widget, its type, the registry entry and a gallery card written. Type-check clean. |
| 65 s | Production build green. |
| 88 s | Running in the app: in the widget menu, drawing data, no console errors. |
One prompt, one pass, under two minutes. So why is it that quick? Mostly because of how little AG Studio asks of a widget.
It's just a React component
The workshop starter is plain TypeScript, and that's the version I timed. Most people will be writing React, though, and there the same widget is an ordinary function component:
export function QuadrantWidget(params: AgWidgetParams<QuadrantDef>) {
    const { api, widgetApi, dataMapping } = params;
    const label = dataMapping.label?.[0];
    const x = dataMapping.x?.[0];
    const y = dataMapping.y?.[0];
    const size = dataMapping.size?.[0];
    const [points, setPoints] = useState<Point[] | null>(null);

    useEffect(() => {
        if (!label || !x || !y || !size) {
            widgetApi.setDisplayState('incompleteDataMapping');
            return;
        }
        widgetApi.setDisplayState('loading');
        let cancelled = false;
        widgetApi.getData({ fields: [label, x, y, size] }).then(({ results }) => {
            if (cancelled) return;
            setPoints(results.rows.map((row) => ({
                label: row[label.key],
                x: Number(row[x.key]),
                y: Number(row[y.key]),
                size: Number(row[size.key]),
            })));
            widgetApi.setDisplayState('displayed');
        });
        return () => { cancelled = true; };
    }, [widgetApi, label, x, y, size]);

    if (!points) return null;
    const theme = getChartTheme(api);
    return (
        <AgQuadrantChart options={{
            theme: {
                ...theme,
                params: { ...theme.params, backgroundColor: 'transparent' },
            },
            data: points,
            labelKey: 'label', xKey: 'x', yKey: 'y', sizeKey: 'size',
            pivot: {
                x: median(points.map((p) => p.x)),
                y: median(points.map((p) => p.y)),
            },
        }} />
    );
}
No base class, no lifecycle methods to learn, no framework of ours to adopt. AG Studio hands the component its field mapping and a widgetApi, and the component renders whatever it likes. Here that's AgQuadrantChart from ag-charts-react. The quadrant is a preset rather than an ordinary series, with its own constructor, and it didn't matter one bit: AG Studio only cares that it gets a component back.
A dozen lines of config become the whole editing UI
Register it, and that's the only other thing you write:
{
    id: 'quadrant-chart',
    label: 'Quadrant',
    icon: quadrantIcon,
    dataMapping: { label: category(), x: numeric(), y: numeric(), size: numeric() },
    form: formWithoutCrossFilter([
        { key: 'label', label: 'Label' },
        { key: 'x', label: 'X value' },
        { key: 'y', label: 'Y value' },
        { key: 'size', label: 'Size' },
    ]),
    comp: QuadrantWidget,
}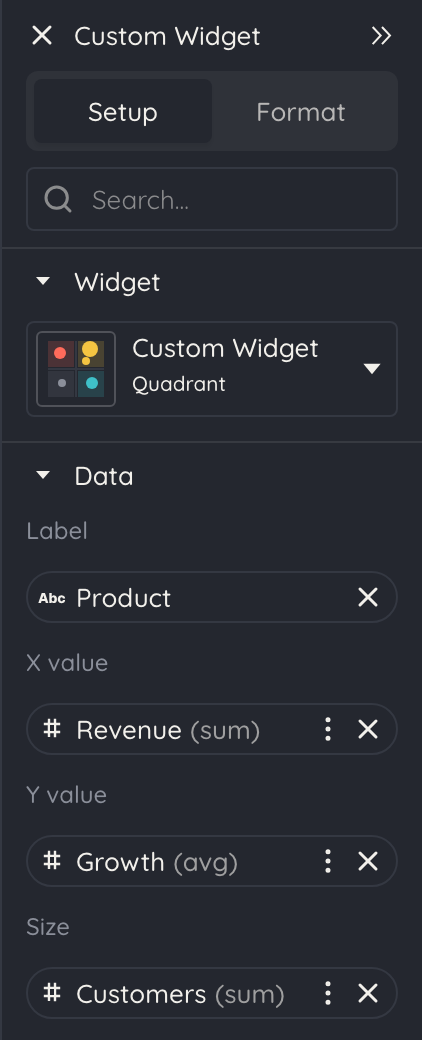
From those few lines AG Studio builds everything around the chart: the entry in the widget menu, the setup panel with four named slots, drag and drop from the data panel, and the rule that a numeric() slot won't take a text field. Anyone building a report can remap the chart to different columns, or switch revenue from a sum to an average, without touching the code again.
The data layer is already done
Look at the getData call above. That's the entire data layer. The widget never sees a database, a query language or a grouping step. It asks for the four fields someone mapped, and the rows come back already grouped by product and aggregated the way the panel says: revenue summed, growth averaged. AG Studio's engine does all of that in the browser. The only real decision left for the widget is where to put the pivot, and splitting at the medians keeps every region busy.
Loading, saving and AG Charts theming come with it
- Loading and empty states. One call to
setDisplayStategives the widget the same spinner and "no data" treatment as every built-in widget. - Saving and sharing. The widget's field choices are part of the report's state, so saving, exporting and importing a report carries it along for free.
- Theming, for AG Charts.
getChartTheme(api)hands the chart the report's palette and fonts, so it matches the built-in widgets and follows the theme switcher. That works because the quadrant is an AG Charts chart. Draw a widget with a different library and you'll style it yourself for now; bringing the report theme to any custom widget is something we may add down the line.
Cross-filtering is the one piece you opt into rather than inherit. By default a widget's data already respects selections made in other widgets. What it won't do on its own is filter other widgets when someone clicks it: the developer writing the widget adds that with one call to toggleCrossFilter in its click handler. And whoever is building the report can choose how each widget responds to selections, filtering, highlighting or ignoring them, right in the setup panel.
A well-designed, typed API is what makes it agent-friendly
To be clear, we didn't design AG Studio's architecture with coding agents in mind. It's just a well-designed, typed interface: a component, a registry entry, one call for data. That turns out to be exactly what makes it easy for an agent to implement. There's very little to decide, very little to get wrong, and the type checker points out the rest before the page ever loads.
And that's the real headline. When AG Charts ships something new on a Tuesday, an AG Studio dashboard can have it on Tuesday too. The gap between the two releases is one prompt.
• A widget is just a component. A React function component (or Angular, Vue or plain TypeScript) plus a registry entry.
• Config becomes UI. Declare the fields a chart needs, and AG Studio builds the menu entry, the setup panel and the validation.
• The data layer is done. A widget asks for fields and gets rows back, already grouped and aggregated.
• The plumbing comes with it. Loading states and saving are built in, and AG Charts widgets pick up the report's theme.
• It's typed end to end. The compiler checks an agent's work before the page ever loads.
Try it!
The workshop starter is public at ag-grid.github.io/ag-studio-iib-workshop, preloaded with data from Wikipedia's lamest edit wars, a quadrant among its custom widgets, and every built-in one besides.