
Projects using AG Grid Enterprise come with Integrated Charting. When you combine AG Charts Enterprise with AG Grid Enterprise the Integrated Charting experience is enhanced with more features.
This post describes the enhancements AG Charts Enterprise brings to AG Grid's Integrated Charting.
What is Integrated Charting
Integrated Charting is the grid feature which enables charts to be created directly from the grid's data, as shown below:
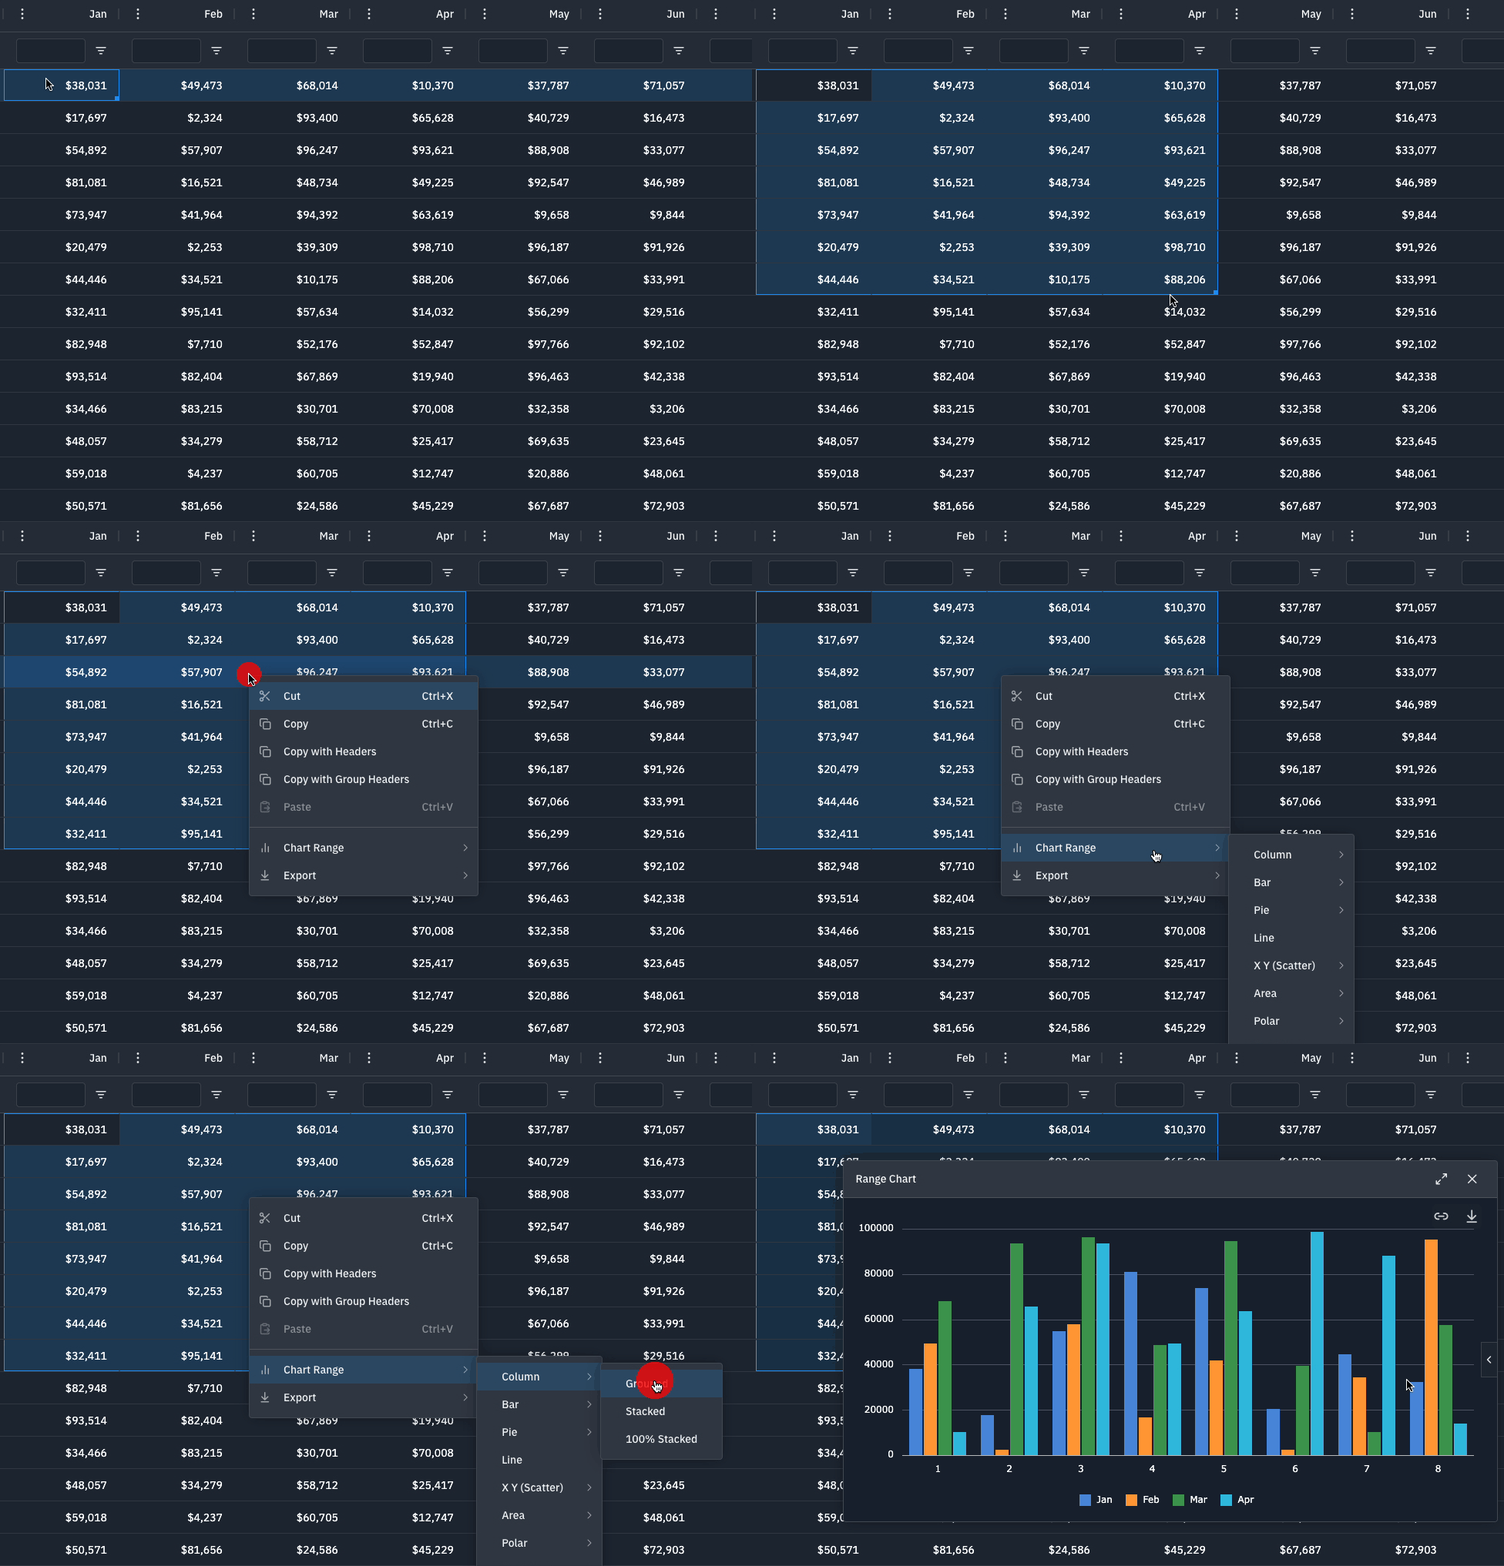
Powered by AG Charts Enterprise, the grid's Integrated Charting experience is enhanced as follows:
Enterprise Feature: Additional Chart Types
Twelve additional Chart Types are added:
- Polar: Radar Line, Radar Area, Nightingale, Radial Column, Radial Bar;
- Statistical: Box Plot, Range Bar, Range Area;
- Hierarchical: Treemap, Sunburst;
- Specialized: Heatmap, Waterfall.
You can create these charts directly via API or allow users to create one from the Context Menu.
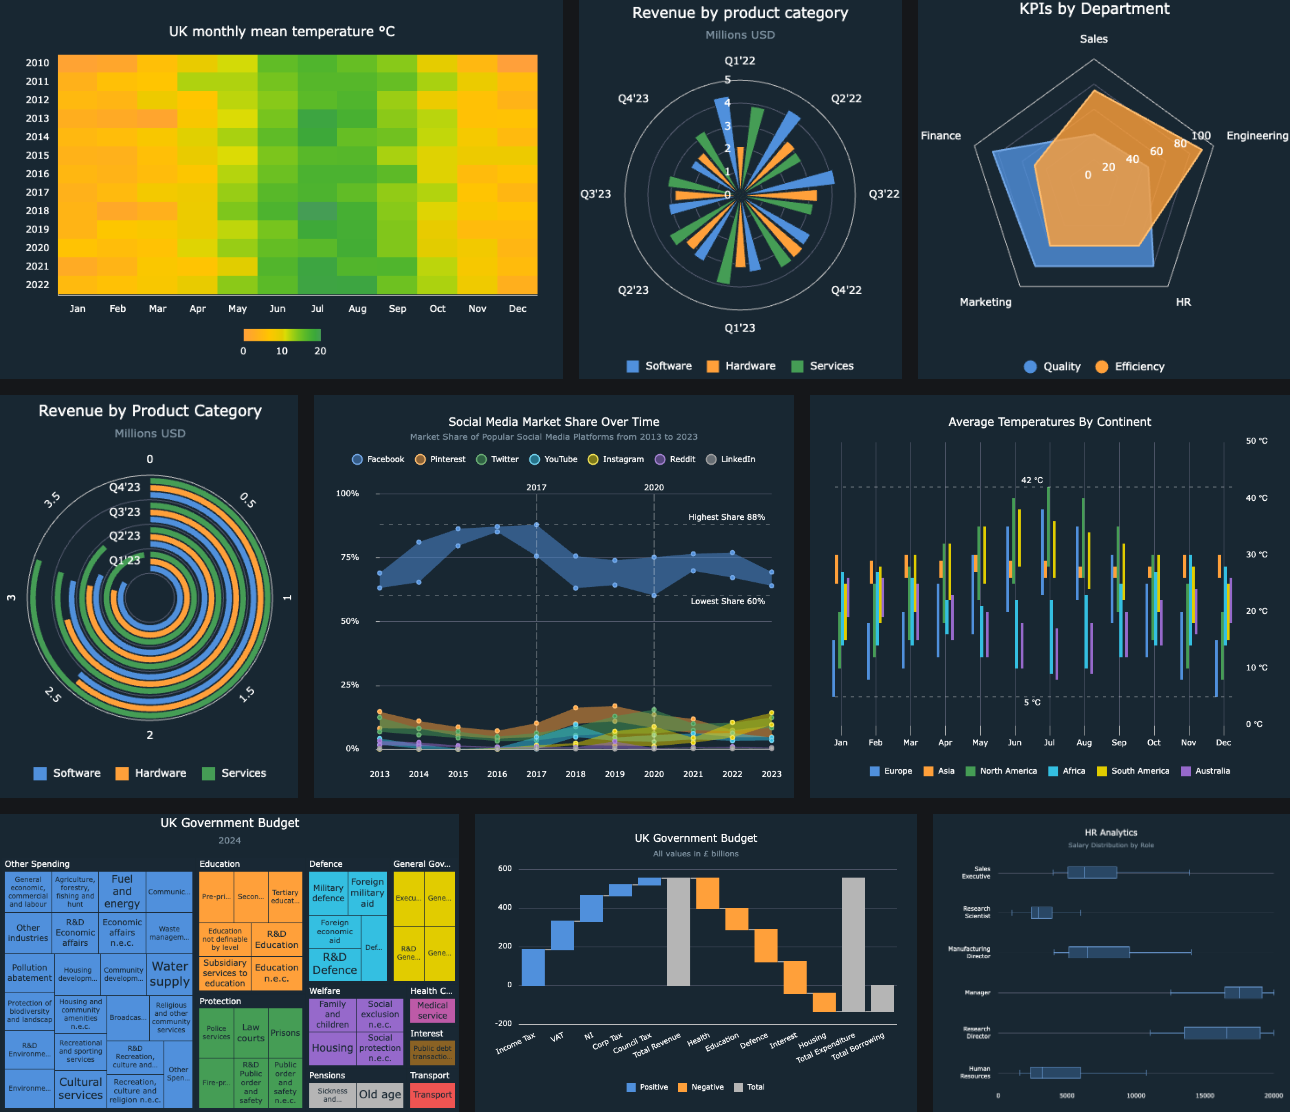
See the Integrated Charts Gallery for a full list of series types & examples.
Enterprise Feature: Enhanced Data Input Panel
The Data Panel has been redesigned to be more powerful and intuitive:
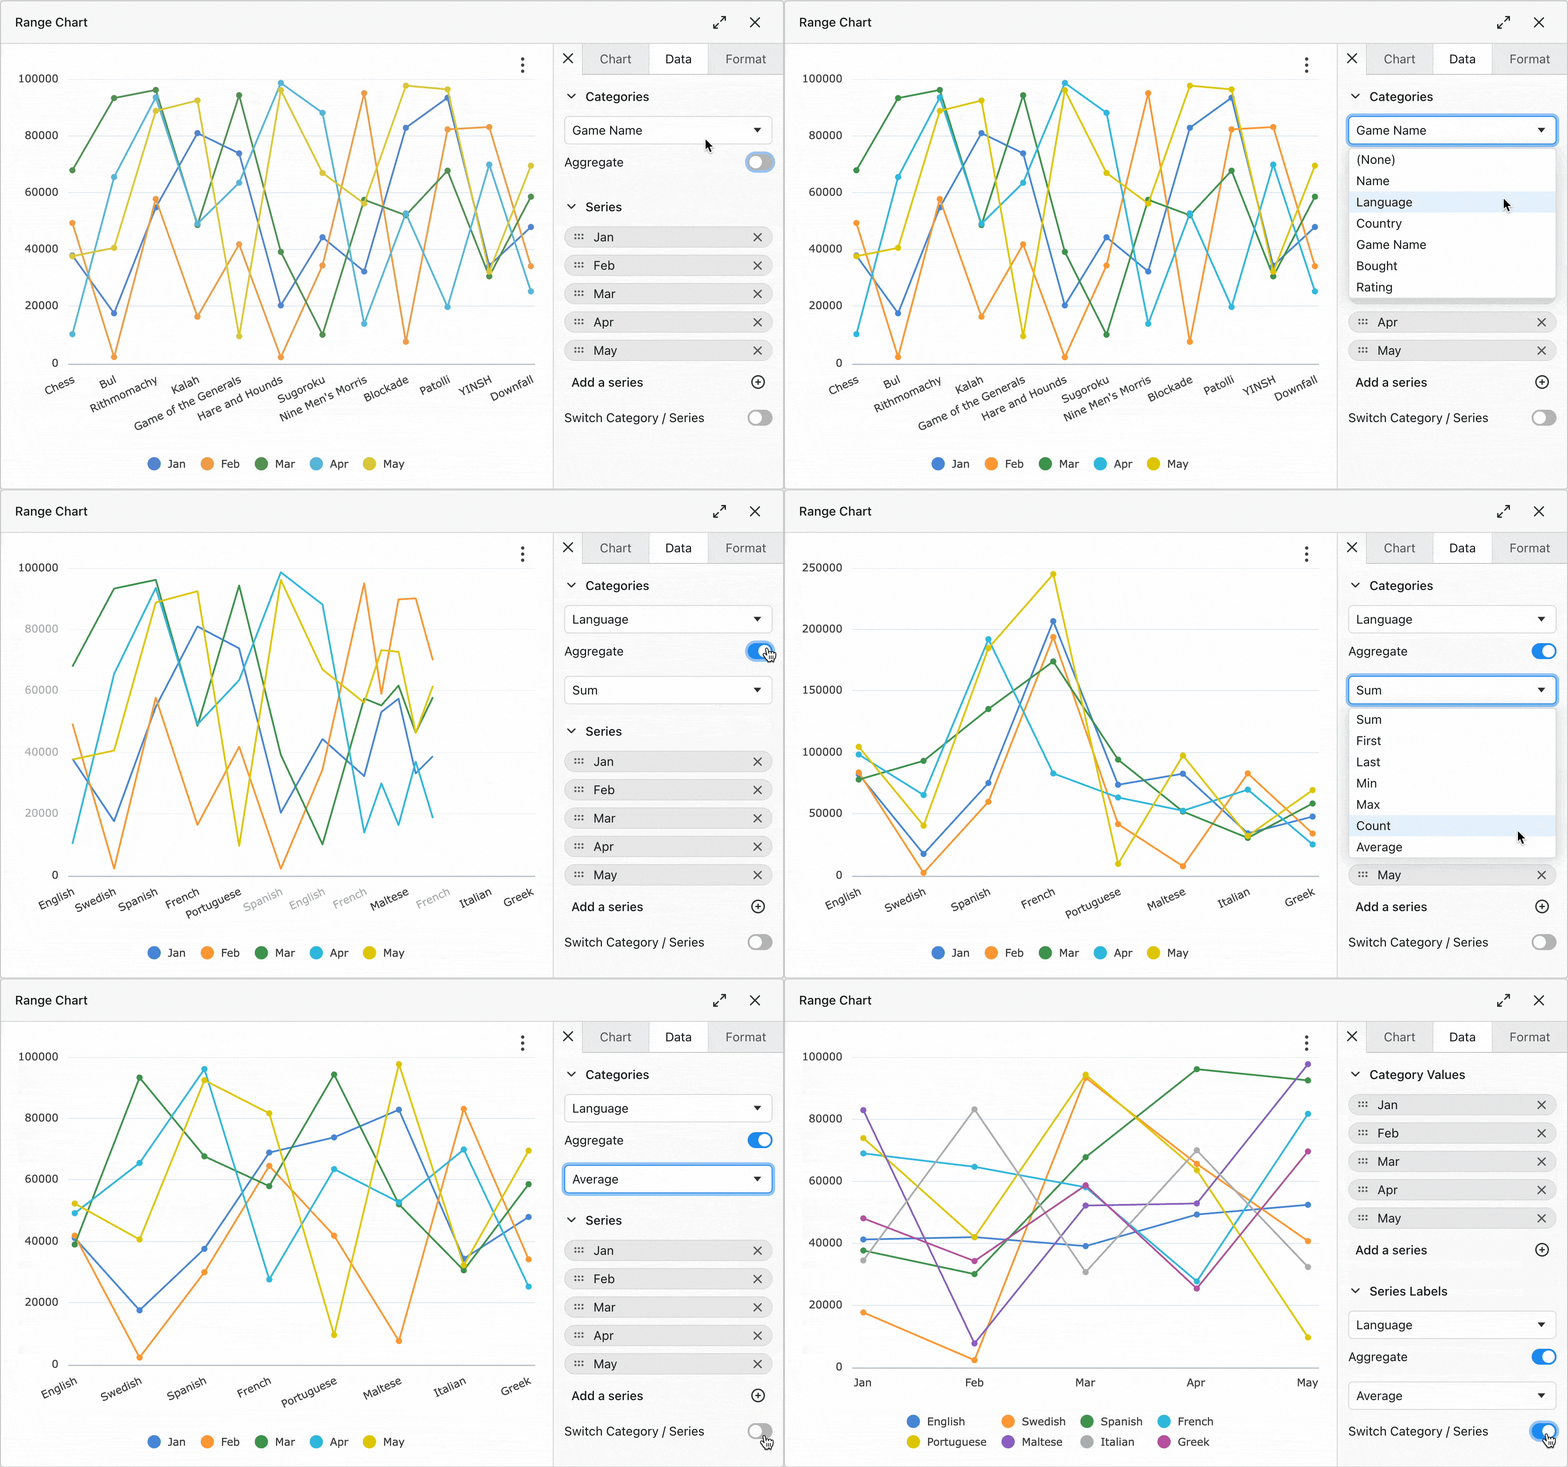
The new Data Panel shows the data requirements of the extensive chart range of Integrated Charts. Additionally, it allows you to set aggregate functions via the UI, and easily switch categories / series.
Enterprise Feature: Interactivity
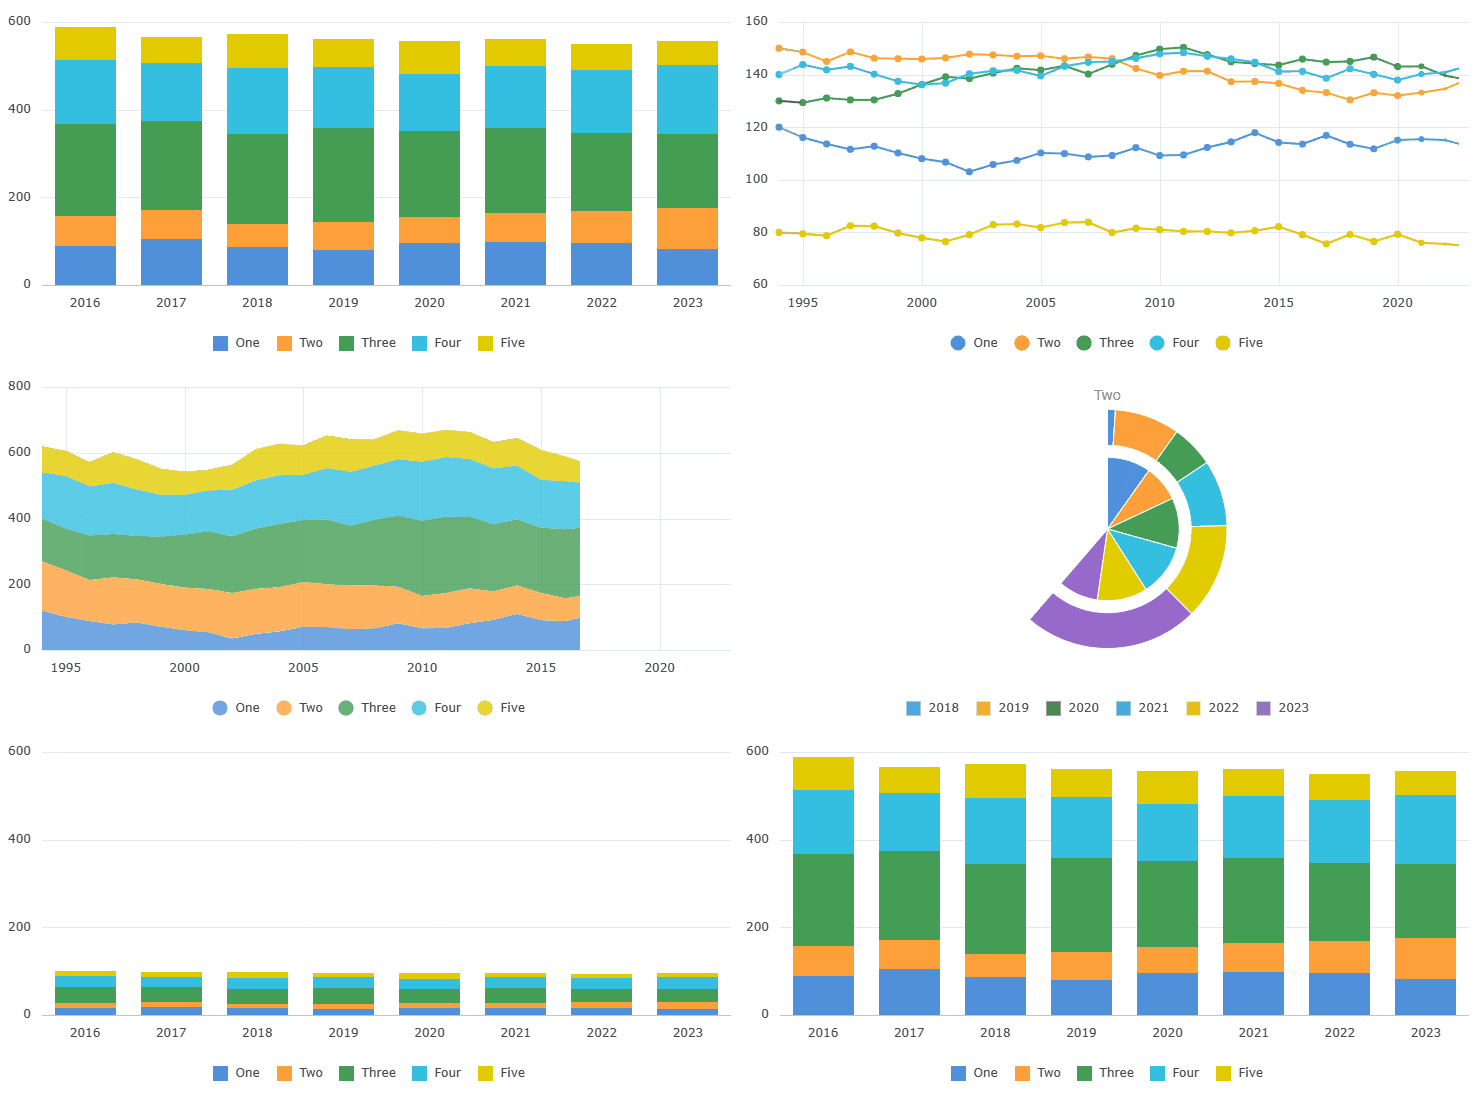
A number of Interactivity features are added:
Animation
Animation is enabled by default when the chart is initially loaded or updated.
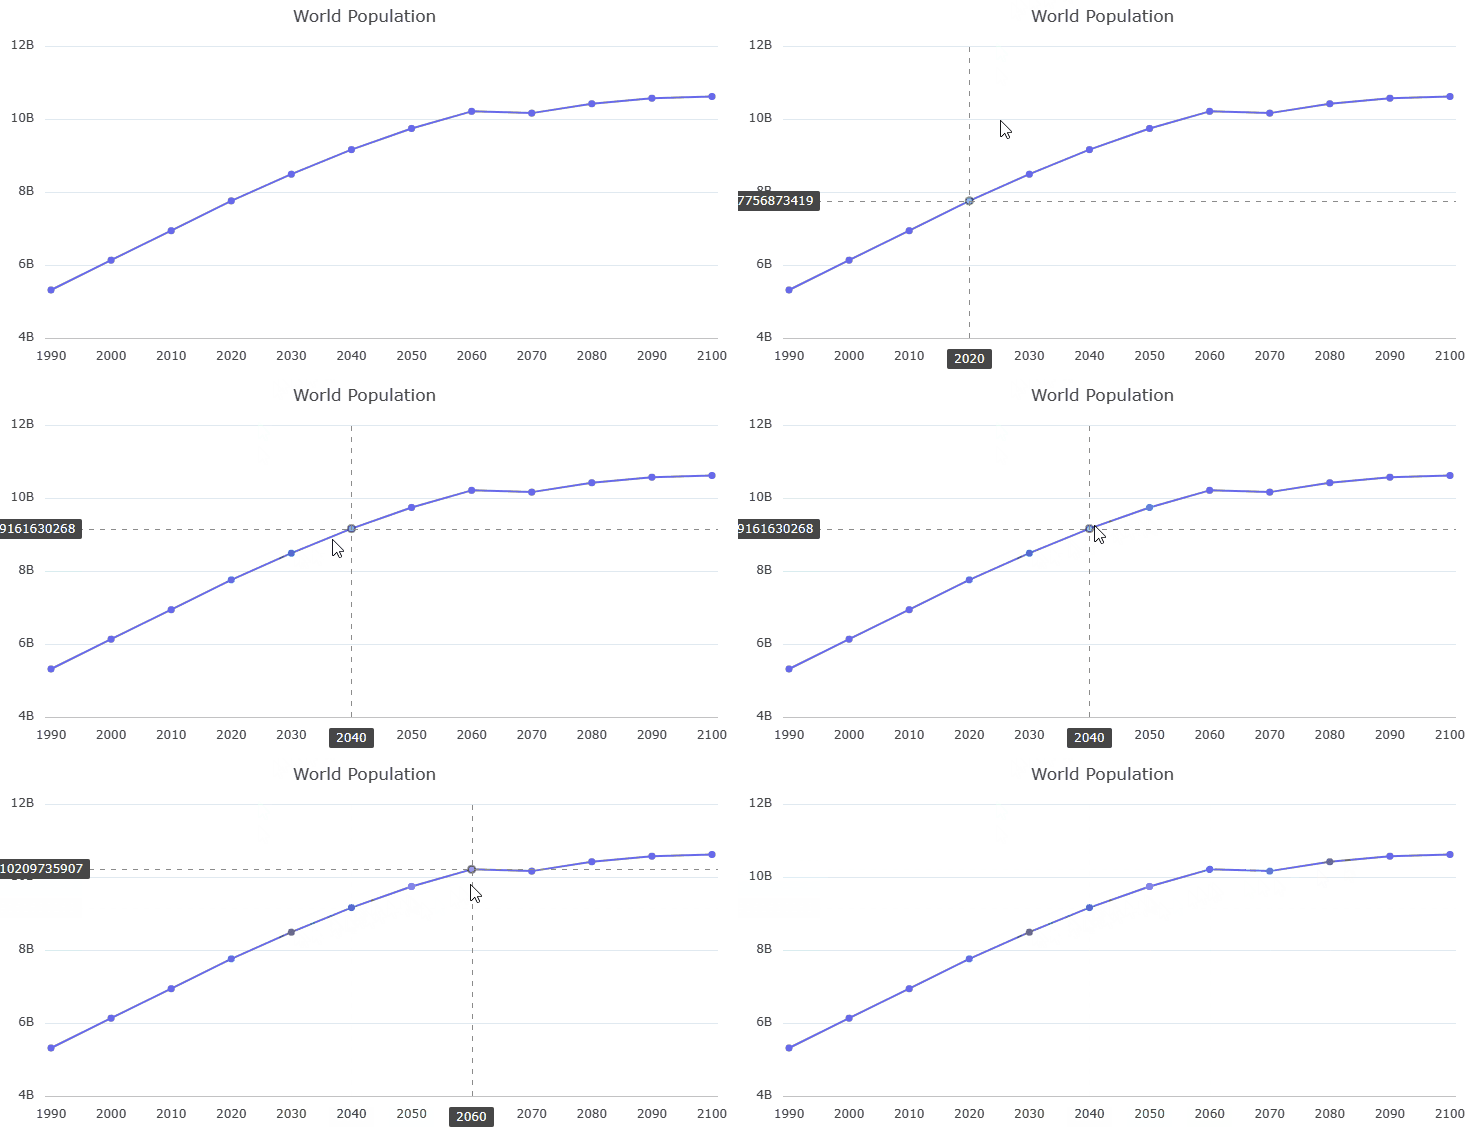
Crosshairs
Use Crosshairs for precise analysis of complex graphs containing many series and data points.
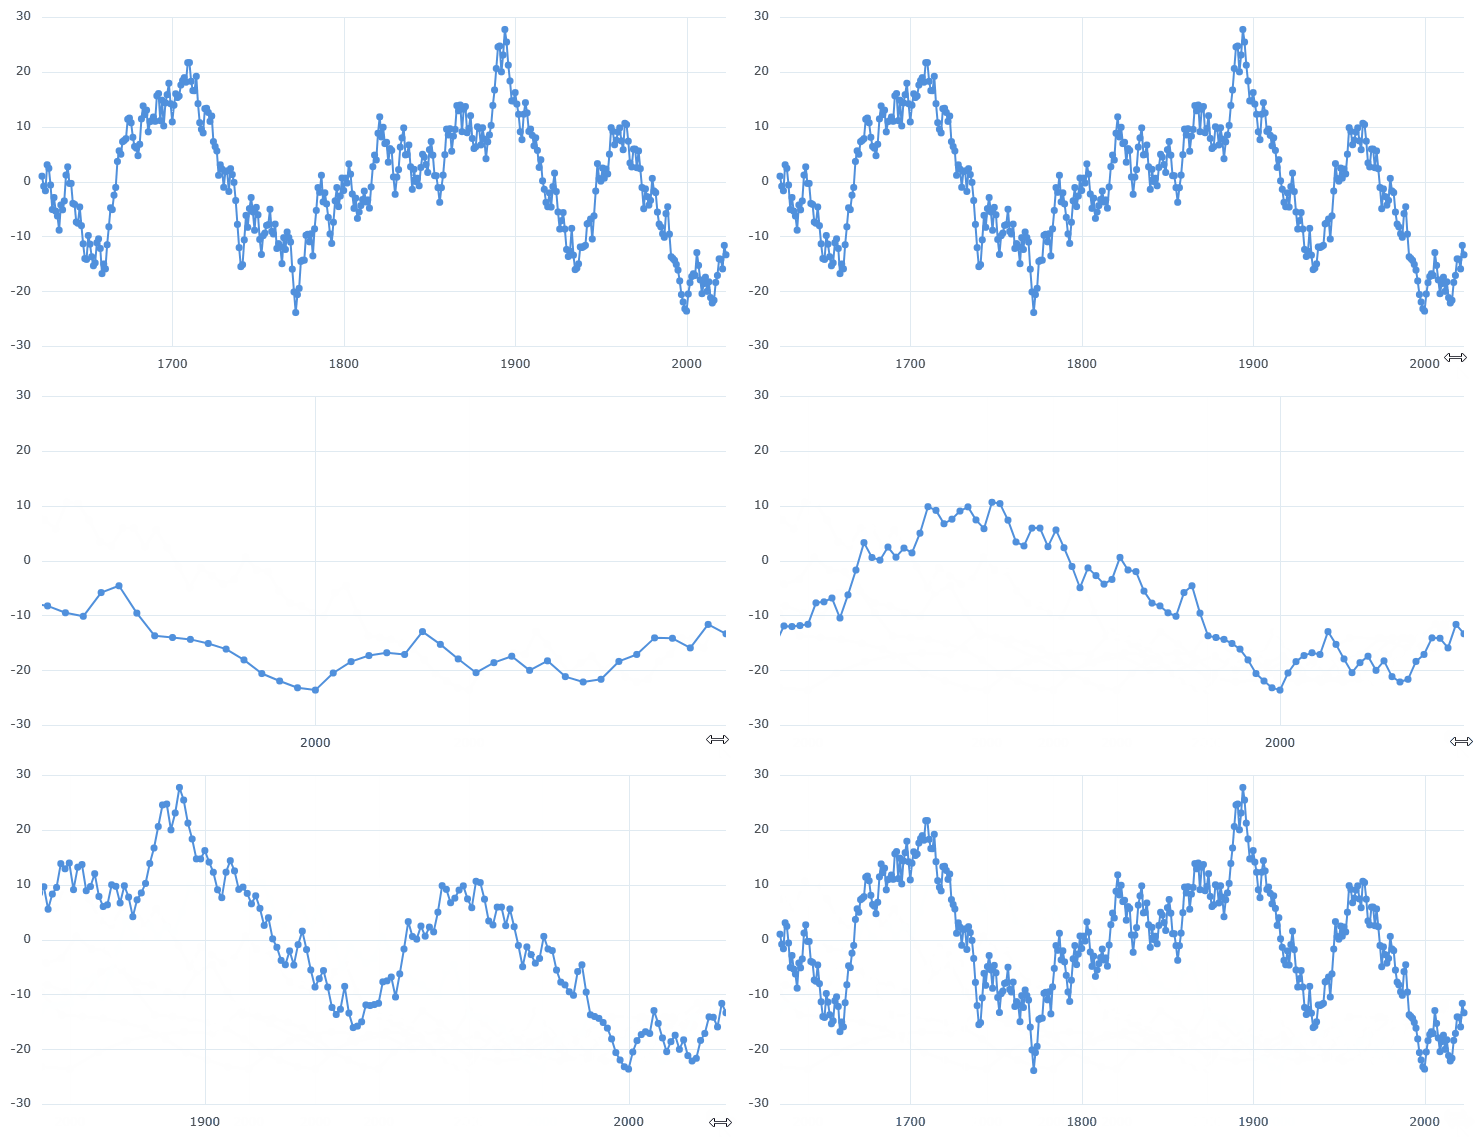
Zoom
Use Zoom to zoom into and out of data, by scrolling with the mouse wheel or selecting an area of the chart to zoom into.
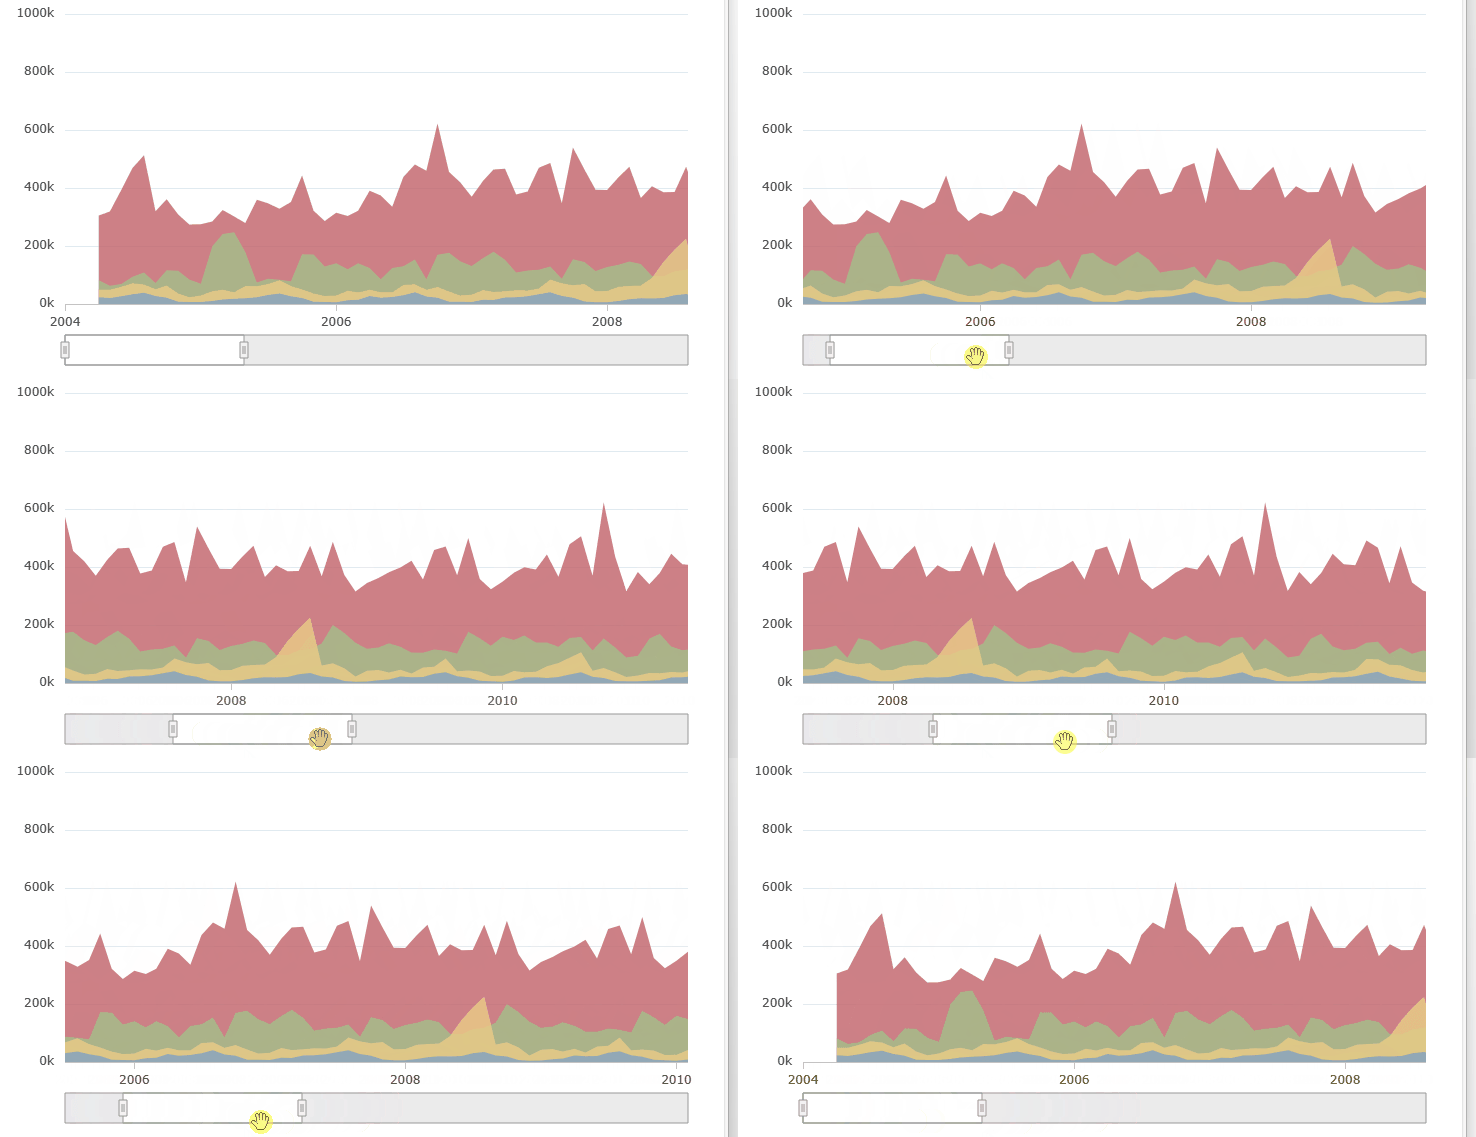
Navigator
The Navigator provides controls for you to zoom and pan around a chart.
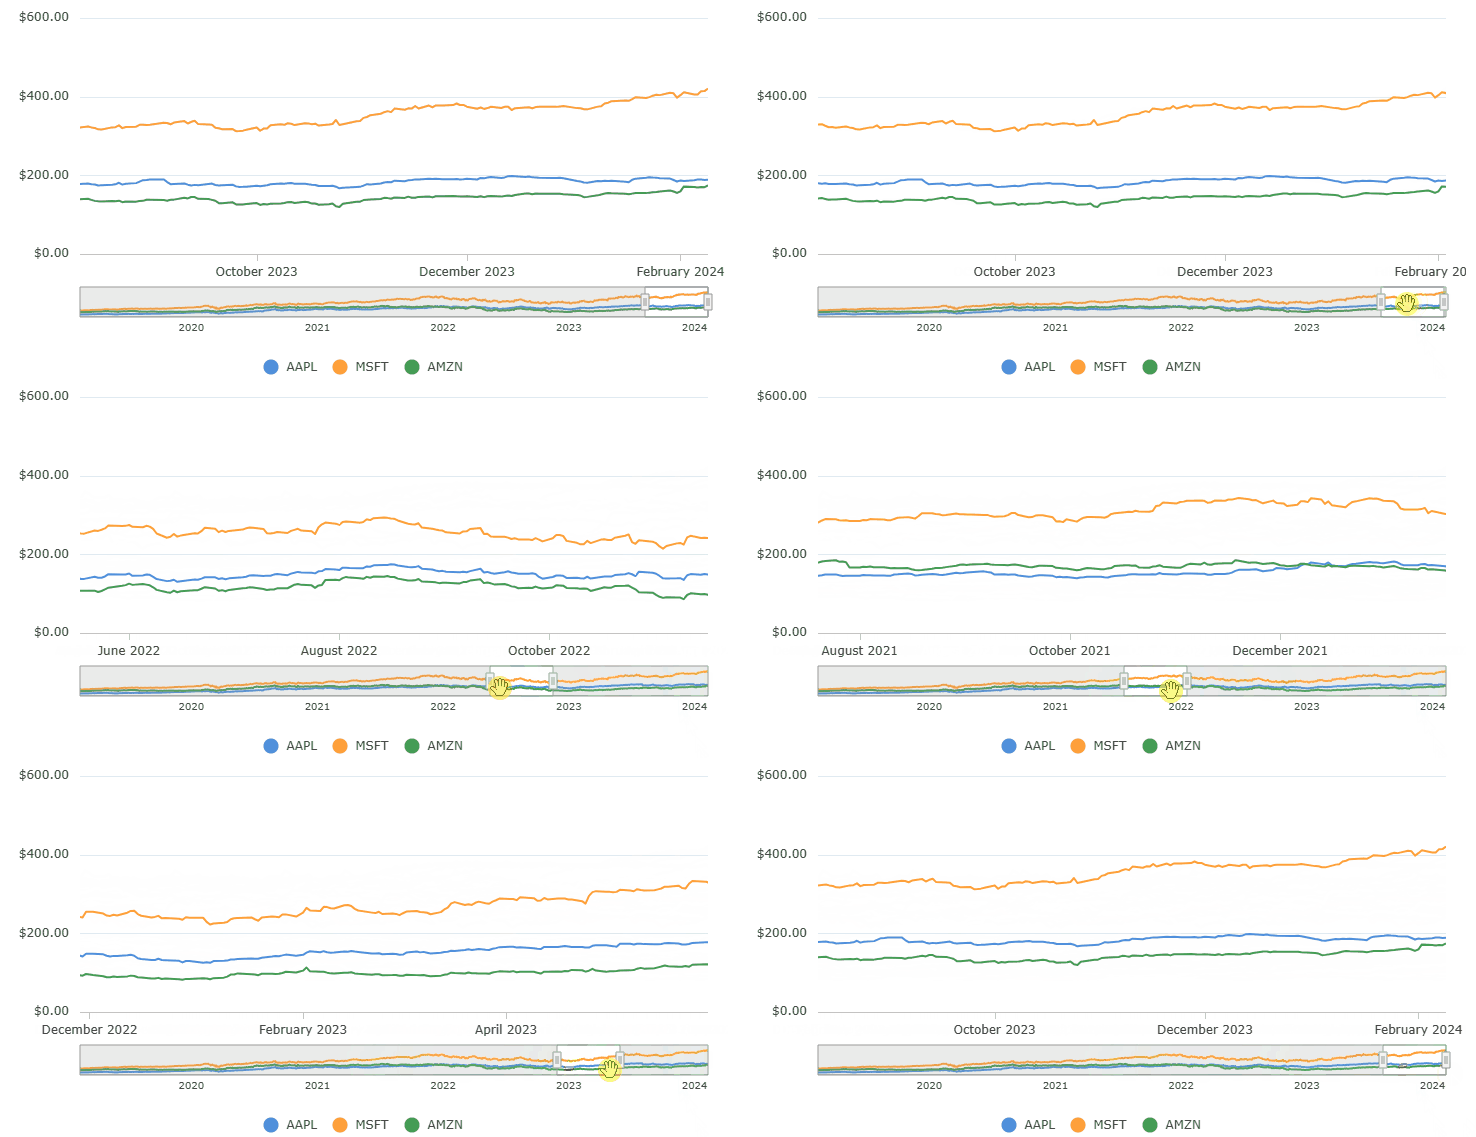
Mini Charts enhance the Navigator with an overview of the full data of the chart to provide more context when zoomed in.
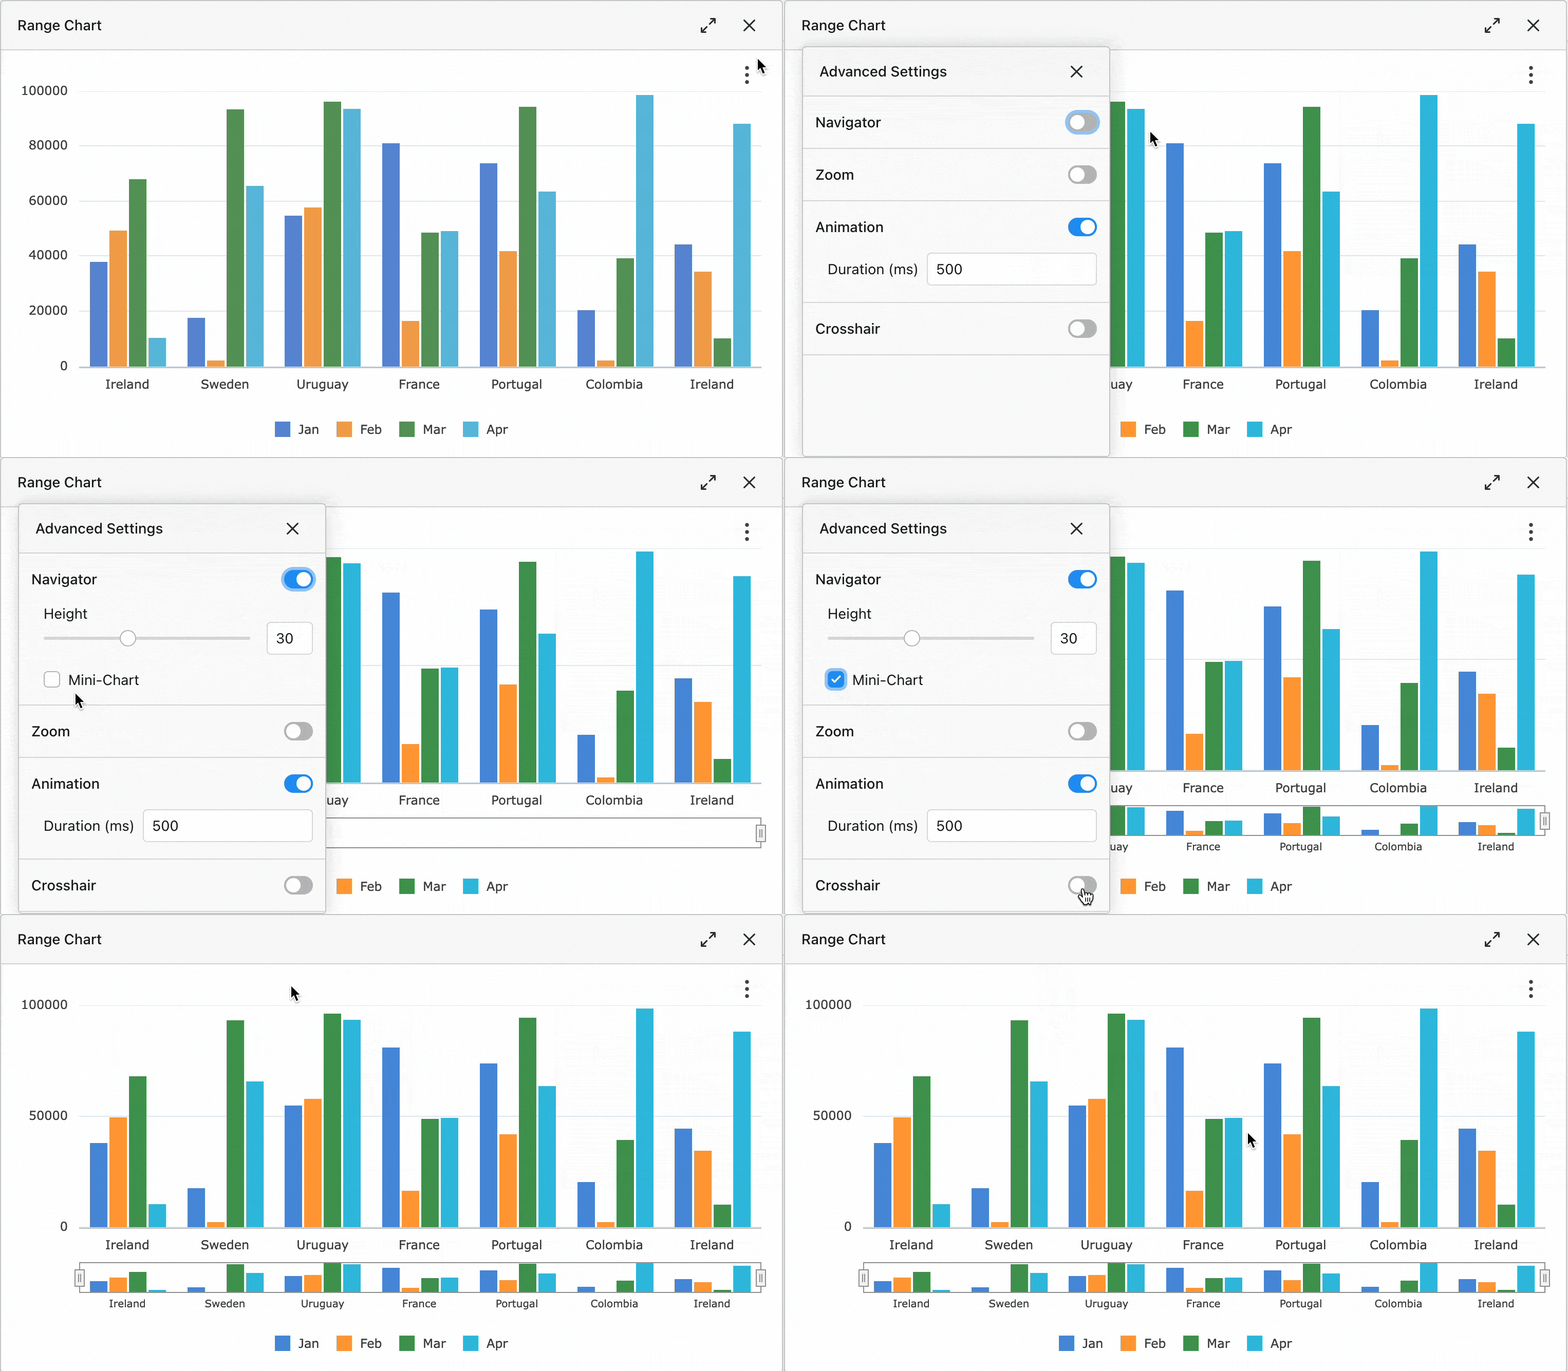
Advanced Settings
You can adjust the default interactivity settings via the Advanced Settings option in the Chart Menu. The settings will be applied universally where applicable.
Try It Out
Please try out these powerful new charting features in your projects.
Using AG Grid Enterprise with AG Integrated Charts Enterprise requires an AG Grid & AG Charts Enterprise Bundle license. Therefore, if you switch to AG Integrated Charts Enterprise and continue using your existing AG Grid Enterprise license key, you will get a Watermark and Warning Message in the console. You can ignore these for your trial period, or contact info@ag-grid.com to get a Bundle Trial License Key.
See Installing Integrated Charts for more details.
The Future
AG Charts Enterprise will continue to receive significant updates over the coming weeks & months from our dedicated in-house Charts Product Team.
Purchasing a license today entitles you to updates for a year, so you'll get all the benefits listed above, as well as all of the new features & series types that we are working on.
AG Charts Enterprise is a big deal for us, you can expect to be very impressed with what's coming!