
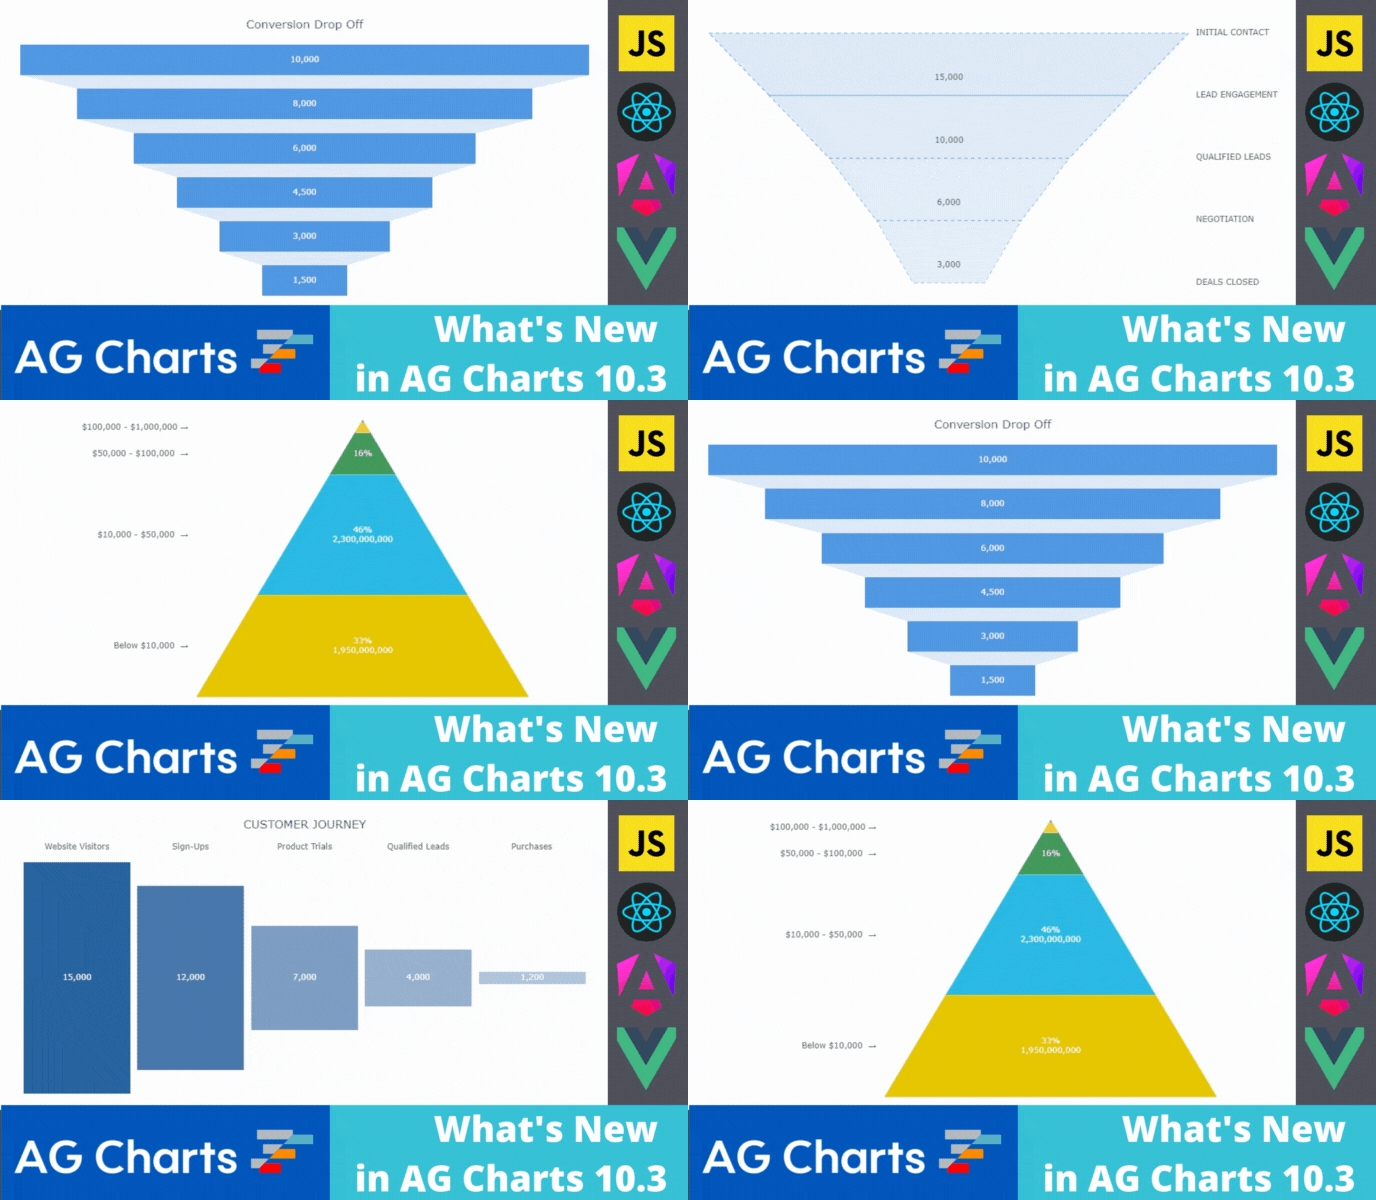
AG Charts 10.3 is an important minor release which adds Funnel and Pyramid Series types, as well as Measuring Tools for Financial Charts. It also includes many improvements and bug fixes:
1. Funnel Series
2. Cone Funnel Series
3. Pyramid Series
4. Measuring Tools
As this is a minor version there are no breaking changes for anyone upgrading from AG Charts 10. However, we recommend reviewing the migration guide when planning to update to this version. You can also see the full list of changes in our changelog.
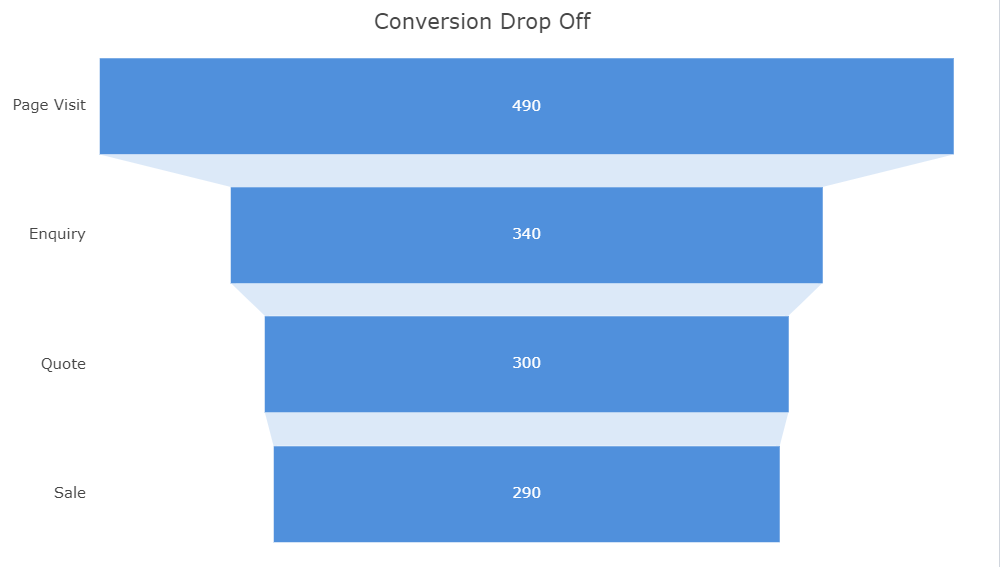
Funnel Series
The Funnel Series illustrates how a value changes during a process, with bar widths representing the value at each stage and drop-offs denoting the change between them.
See this documented here and illustrated below:
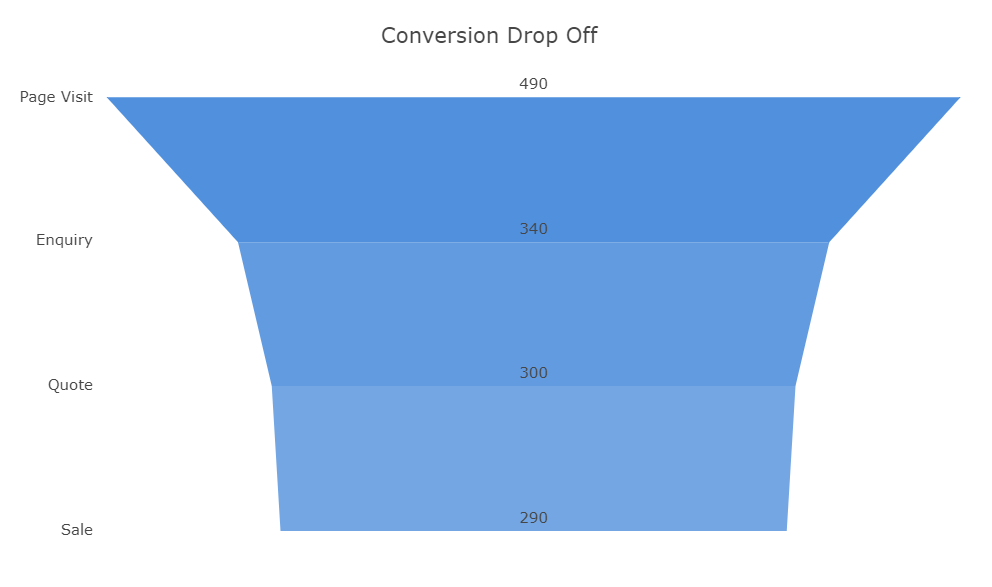
Cone Funnel Series
The Cone Funnel Series illustrates how a value changes during a process, with a line representing the value at each stage and filled areas denoting the change between them.
See this documented here and illustrated below:
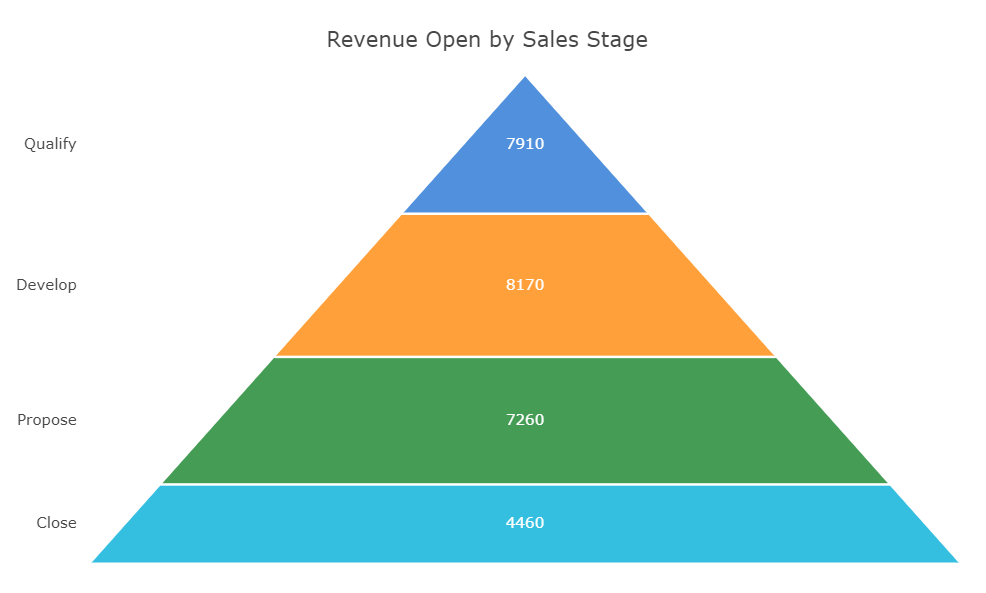
Pyramid Series
The Pyramid Series is a triangular shaped visualization that uses the height of each segment to represent its value as a proportion of the whole.
See this documented here and illustrated below:
Measuring Tools
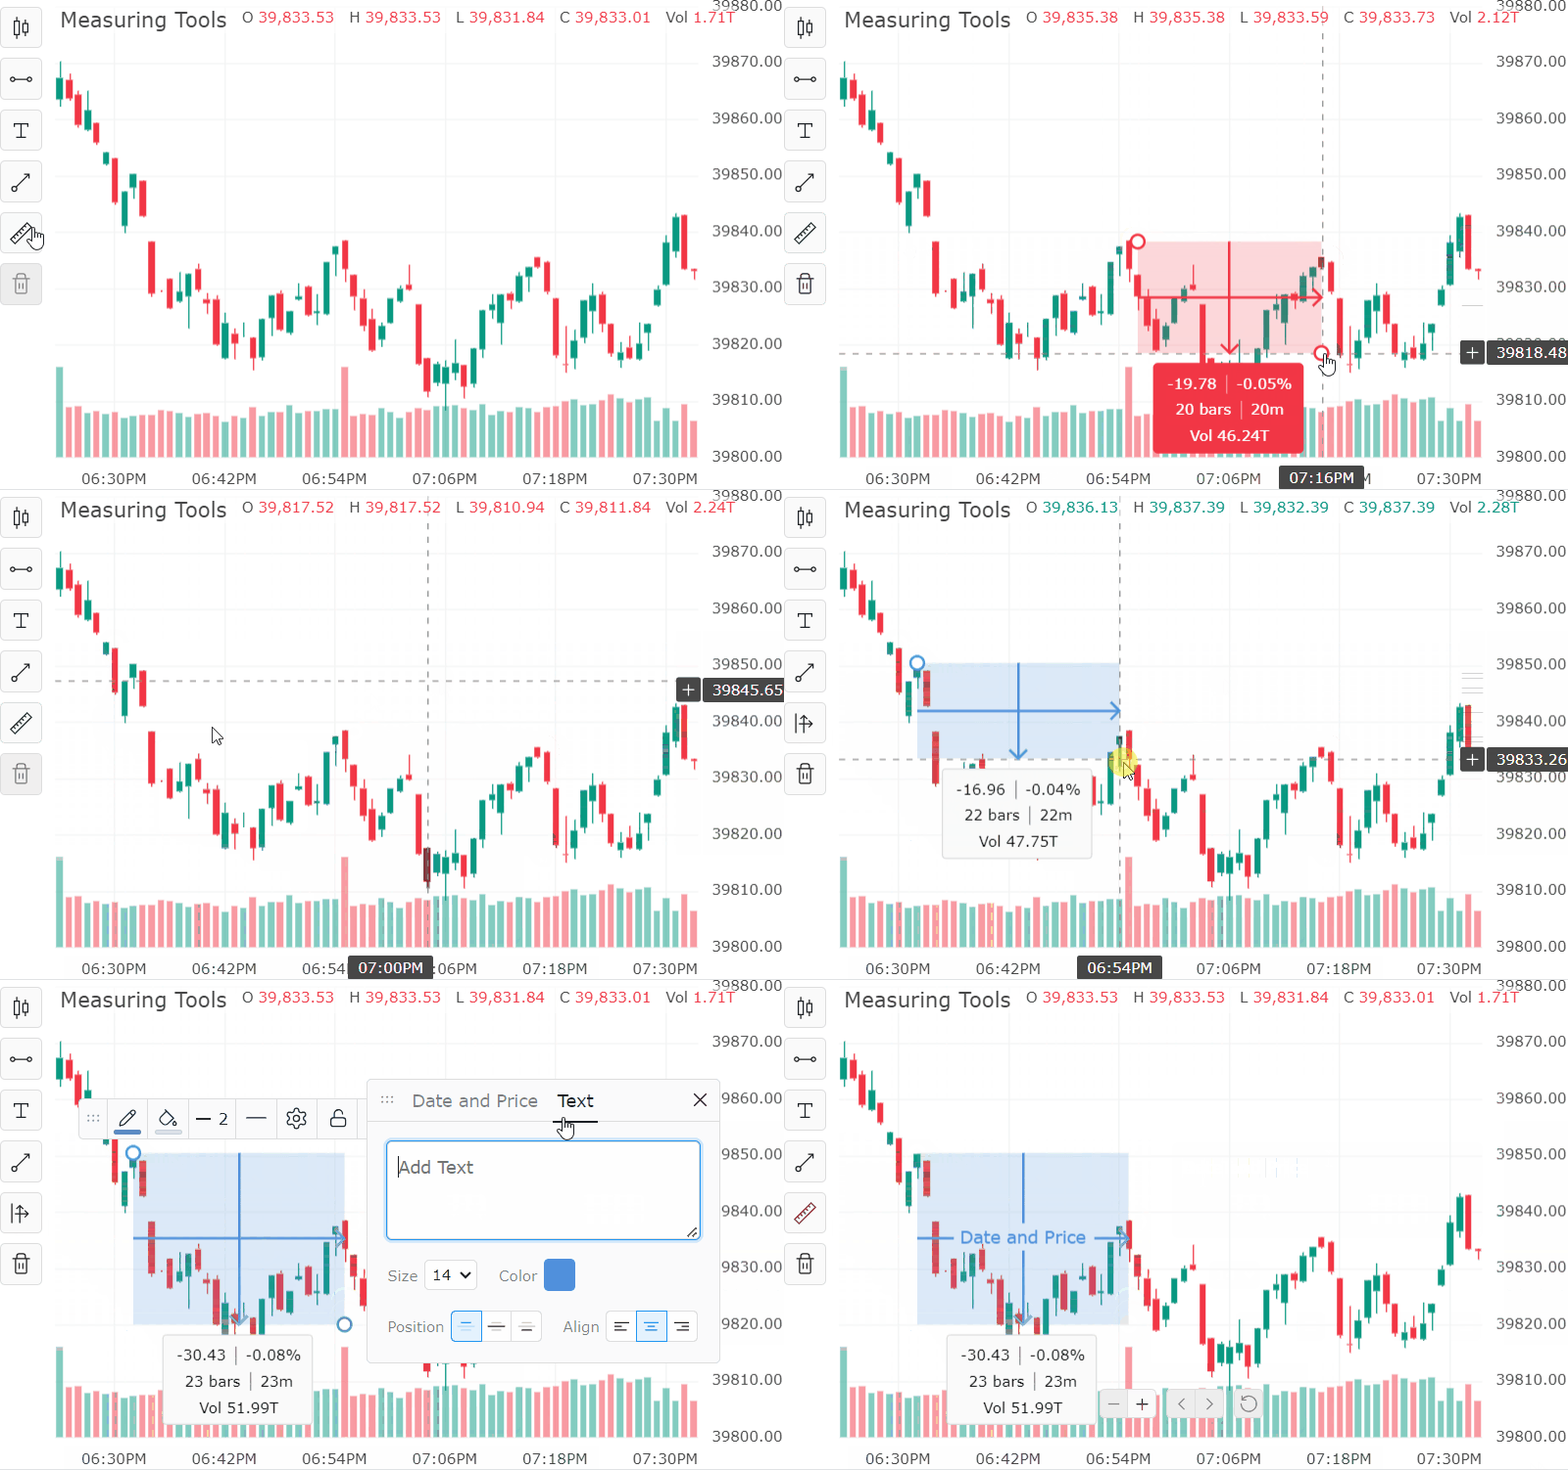
The various Financial Charts Measuring Tools allow users to measure the price and date difference between two points on the chart. These tools include a quick measurer tool for temporary measurements, as well as permanent measurers for price and date ranges both separately and combined. Relevant statistics are displayed beneath the measure.
See this documented here and illustrated below:
Summary
AG Charts 10.3 is an important minor version - it adds Funnel and Pyramid Series types, as well as Measuring Tools for Financial Charts. It also includes many improvements and bug fixes.
If you're upgrading from a previous version of AG Charts, we recommend reviewing the release notes when planning to update. You can also see the full list of changes in our changelog.
As always, we’re keen to help you upgrade and to hear your feedback.
Happy coding!