Build a payments dashboard without building a dashboard Shipping drill through in AG Studio, and why we left the journey to developers What's new in AG Studio 3.1 What's New in AG Grid 36.3 What's new in AG Charts 14.3 2026 AG Studio Launch Week WebMCP in AG Studio dashboards Hackathon: PayPal and AG Studio From Embedded Dashboards to Programmable Analytics Grids + Charts != Dashboards
Design System What's New in AG Grid's Figma Design System AG Grid’s Figma Design System variables now map 1:1 to Theming API parameters. Learn to build a custom theme in Figma and export it as production-ready code.
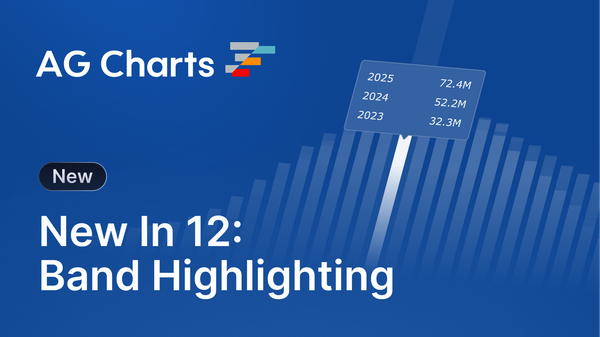
Releases What's New in AG Charts 12.1 AG Charts 12.1 adds alternating band shading, extra axis zoom interactions, axis label truncation, a floating legend, fills and borders, and multi-style text.
Releases What's New in AG Grid 34.1 AG Grid 34.1 introduces tree data support for master/detail, testing IDs, improved integrated charts formatters, and accessibility improvements.
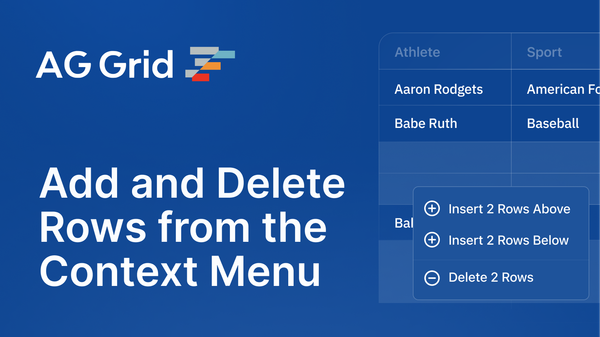
How To How To Add and Delete Rows in AG Grid from the Context Menu Add Excel-style row insert and delete to AG Grid’s context menu using cell selection and the Transaction API. Live demo and code for React, Angular, Vue and JS.
Releases What's New in AG Grid 34 AG Grid Enterprise 34 introduces a new filters tool panel, cell editor validation, bulk & batch cell editing, and support for tree data drag & drop.
Releases What's New in AG Charts 12 AG Charts 12 adds Axis Band Highlight, Axis Label Automatic Wrapping, Global Formatter, `context` Object, Typescript Generics for Data and Context, Improved Series Highlight Options and more
Misc AG Grid Showcase: Examples, Demos and Extensions Explore AG Grid’s best features with live demos, use case examples, open source apps, and seed projects for React, Angular, Vue, and JavaScript.
Misc No user left behind: let’s talk accessibility Why accessibility matters for web apps: the laws and WCAG standards, the commercial case, what good looks like, and how AG Grid and AG Charts help you comply
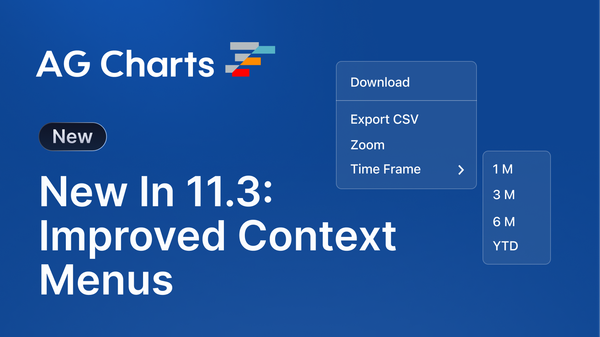
Releases What's New in AG Charts 11.3 AG Charts 11.3 adds Unit Time Axis, Axis Parent Label/Ticks Support, Improved Context Menu, Image Fills, Support for Google Fonts and more
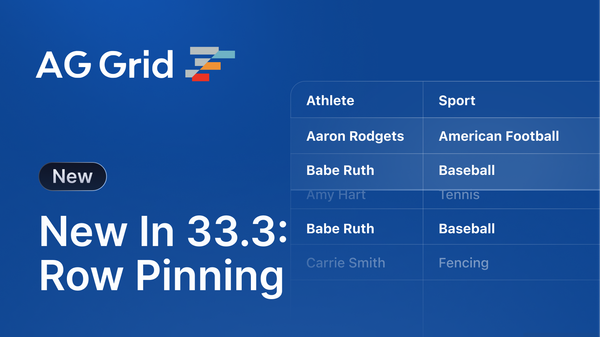
Releases What's New in AG Grid 33.3 AG Grid Enterprise 33.3 introduces Row Pinning, Row Height Resizing, Grand Total Row Pinning, speeds up grid rendering and improves quality
Misc AG Grid Joins the Open Source Pledge AG Grid joins the Open Source Pledge, sponsoring projects like Webpack and ESLint at over $2,000 per developer per year. See which projects we support and why.
Releases What's New in AG Charts 11.2 AG Charts 11.2 adds shared and compact tooltips, tooltip pagination, gradient and pattern fills, options validation with suggestions, and Figma design assets.
Releases What's New in AG Grid 33.2 AG Grid Enterprise 33.2 introduces Find, improves Tree Data, Status Bar, speeds up grid rendering and enhances accessibility and more
Releases What's New in AG Grid 33.1 AG Grid Enterprise 33.1 reduces bundle size, adds Row Numbers Column, Row Spanning, Tree Data Nested Records and Master/Detail Row Selection
Releases What's New in AG Charts 11.1 What's New in AG Charts 11.1 - Y-Axis Auto-scaling, Annotations on Cartesian Charts, Theme Parameters, Touch Interactions with Gesture Support
Testing End-to-End Testing for AG Grid in React with Cypress Learn how to write E2E tests for AG Grid with Cypress, including how to test rendering, user interaction, and accessibility.
Testing Unit Testing AG Grid with React Testing Library + Vitest Learn how to unit test your AG Grid React Tables with React Testing Library and Vitest.
Introducing Our Figma Design System Sticker Sheets Use our new Sticker Sheets to drop pre-built AG Grid and AG Charts components into your Figma designs, making it even easier to create prototypes.
React Writing E2E Tests for AG Grid React Tables with Playwright Write end-to-end tests for AG Grid React tables with Playwright, covering async data loading, sorting, filtering, cell editing, and accessibility checks.
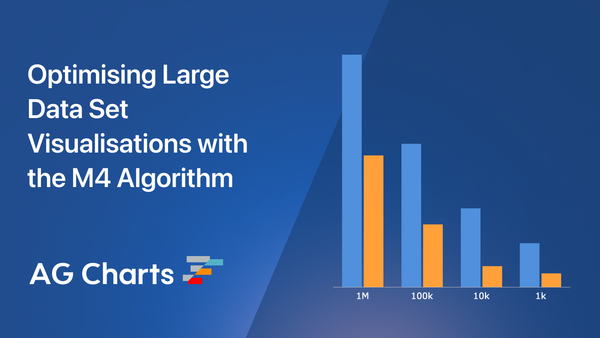
M4 Algorithm: Optimizing Large Dataset Visualizations A deep dive into how we implemented the M4 algorithm to create a line chart that can support over a million data points and maintain 60fps during interactivity.
React Using AG Grid with Next.js to Build a React Table Learn how to integrate AG Grid with Next.js, install your license key, and use advanced features like the Server-Side Row Model and Integrated Charting.