AG Charts implements touch and multi-touch support, enabling interactivity across all devices.
Touch Options Copy Link
All interactivity is available via touch input.
For example:
- Tap the series area to show tooltips and crosshairs.
- Tap or double-tap to toggle a legend item, reset zoom, or press any of the UI buttons.
- Any click and double-click events are also triggered by a tap or double-tap.
- Long tap to bring up the context menu.
- Drag to zoom the axes, pan a zoomed chart, or interact with annotations.
- Use two finger pinch gestures to zoom in or out of a chart, and two finger drag to pan a zoomed chart.
Single Finger Touch Dragging Copy Link
By default, Single Finger Touch Drag events are handled like mouse drag events. To change the input handling behaviour of these events, use touch.dragAction.
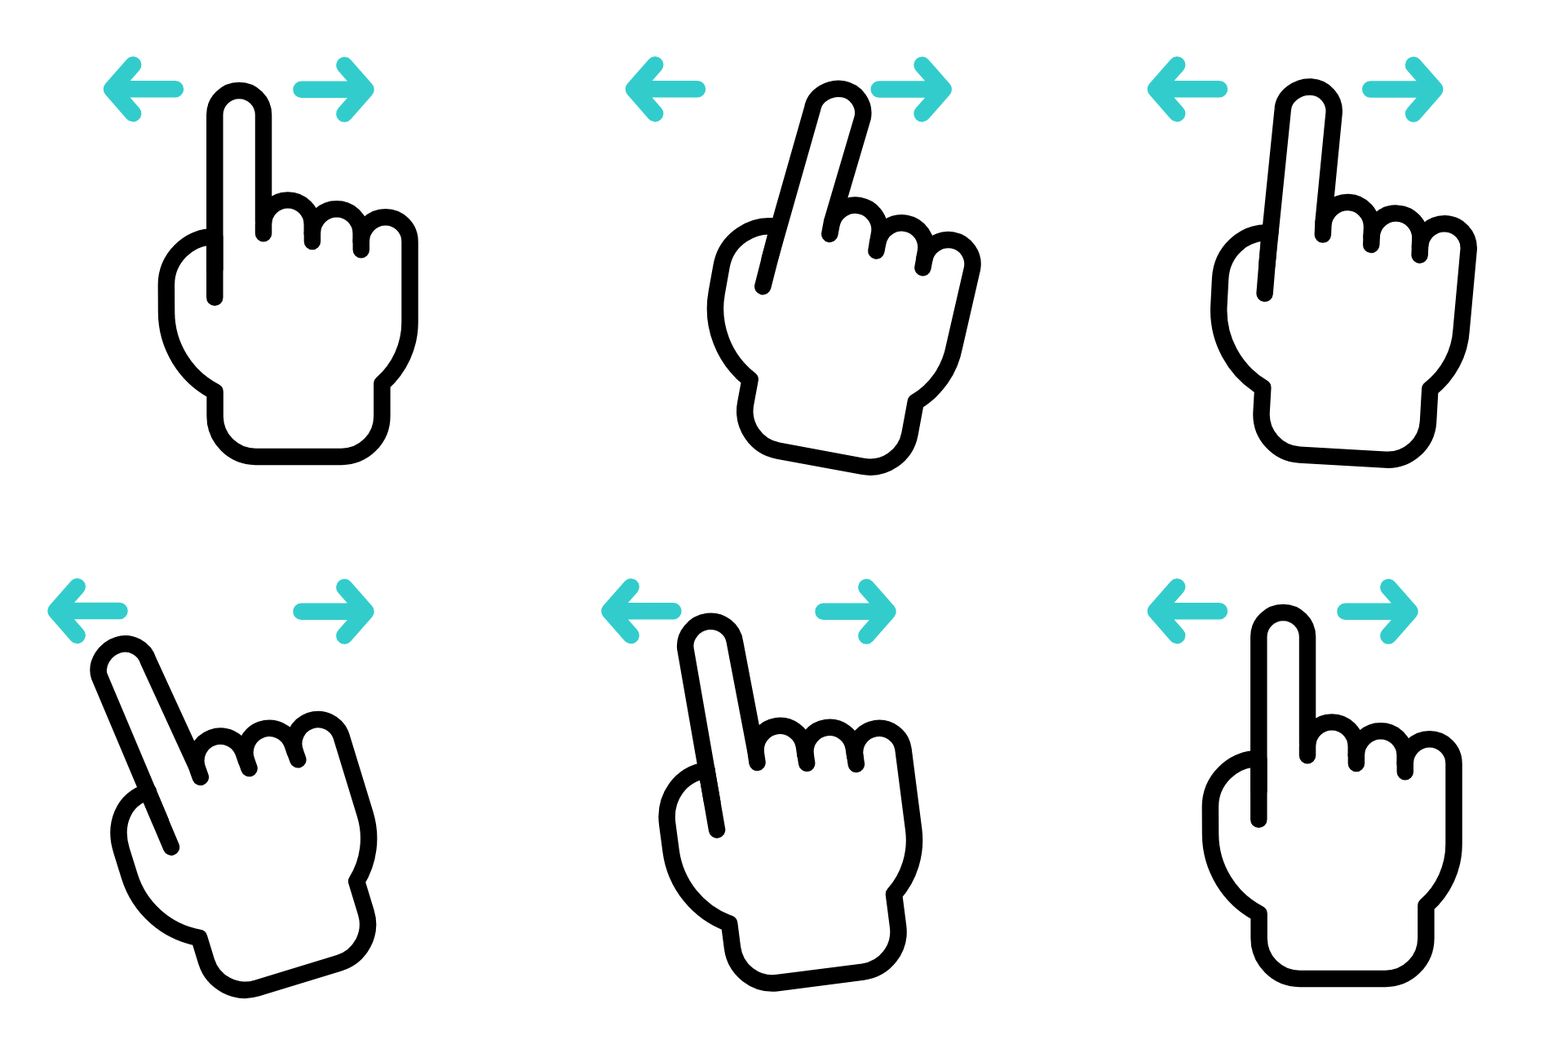
Single Finger Drag
Drag with a single finger to pan or hover a chart.
import { createApp, defineComponent, ref } from "vue";
import { AgCharts } from "ag-charts-vue3";
import type { AgChartOptions } from "ag-charts-types";
import {
  AnimationModule,
  CandlestickSeriesModule,
  ContextMenuModule,
  CrosshairModule,
  LegendModule,
  ModuleRegistry,
  NumberAxisModule,
  OrdinalTimeAxisModule,
  ZoomModule,
} from "ag-charts-enterprise";
import { getData } from "./data";
import clone from "clone";

ModuleRegistry.registerModules([
  AnimationModule,
  CandlestickSeriesModule,
  CrosshairModule,
  LegendModule,
  NumberAxisModule,
  OrdinalTimeAxisModule,
  ZoomModule,
  ContextMenuModule,
]);

const ChartExample = defineComponent({
  template: `
    <div class="example-controls">
      <div class="controls-row">
        <span>Drag Action:</span>
        <div class="button-group" role="group" aria-label="Drag Action">
          <input type="radio" id="dragAction-none" name="drag-action" value="none" checked="" v-on:change="changeAction($event)">
            <label for="dragAction-none"><code>'none'</code></label>
            <input type="radio" id="dragAction-drag" name="drag-action" value="drag" v-on:change="changeAction($event)">
              <label for="dragAction-drag"><code>'drag'</code></label>
              <input type="radio" id="dragAction-hover" name="drag-action" value="hover" v-on:change="changeAction($event)">
                <label for="dragAction-hover"><code>'hover'</code></label>
              </div>
            </div>
          </div>
          <ag-charts
            :options="options"
          />
  `,
  components: {
    "ag-charts": AgCharts,
  },
  setup(props) {
    const options = ref<AgCartesianChartOptions>({
      data: getData(1e3),
      animation: { enabled: false },
      touch: { dragAction: "none" },
      zoom: {
        enabled: true,
        enableAxisDragging: false,
      },
      initialState: {
        zoom: {
          ratioX: { start: 0.48, end: 0.52 },
          ratioY: { start: 0.15, end: 0.6 },
        },
      },
      series: [
        {
          type: "candlestick",
          xKey: "timestamp",
          lowKey: "low",
          highKey: "high",
          openKey: "open",
          closeKey: "close",
        },
      ],
    });

    const changeAction = (event) => {
      const optionsCopy = clone(options.value);

      const newAction = event.target.value;
      if (optionsCopy.touch) {
        optionsCopy.touch.dragAction = newAction;
      }

      options.value = optionsCopy;
    };

    return {
      options,
      changeAction,
    };
  },
});

createApp(ChartExample).mount("#app");
const startPrice = 100;
const maxDailyPriceChange = 5;
const maxRangeDelta = 1;

function sfc32(a: number, b: number, c: number, d: number) {
  return function () {
    a >>>= 0;
    b >>>= 0;
    c >>>= 0;
    d >>>= 0;
    let t = (a + b) | 0;
    a = b ^ (b >>> 9);
    b = (c + (c << 3)) | 0;
    c = (c << 21) | (c >>> 11);
    d = (d + 1) | 0;
    t = (t + d) | 0;
    c = (c + t) | 0;
    return (t >>> 0) / 4294967296;
  };
}

function seedRandom(seed = 1337): () => number {
  const realSeed = seed ^ 0xdeadbeef; // 32-bit seed with optional XOR value
  // Pad seed with Phi, Pi and E.
  // https://en.wikipedia.org/wiki/Nothing-up-my-sleeve_number
  return sfc32(0x9e3779b9, 0x243f6a88, 0xb7e15162, realSeed);
}

export function getData(days: number) {
  let currentPrice = startPrice;
  const random = seedRandom();
  return Array.from({ length: days }, (_, i) => {
    // Note time is reversed
    const close = currentPrice;
    const open = close + (random() * 2 - 1) * maxDailyPriceChange;
    currentPrice = open;

    const high = Math.max(open, close) + random() * maxRangeDelta;
    const low = Math.min(open, close) - random() * maxRangeDelta;

    const timestamp = new Date(2024, 0, 0 /* End of 2023 */, -i);

    return { timestamp, open, close, high, low };
  }).reverse();
}
{
    touch: {
        dragAction: 'drag' | 'hover' | 'none',
    },
}
In this example:
dragAction: 'none'disables the chart's Single Finger input handling, scrolling the entire page.dragAction: 'drag'emulates mouse dragging, panning the viewport if possible.dragAction: 'hover'emulates mouse movements, updating the tooltip and highlighted node.
Two Finger Zoom-Pan Copy Link
By default, charts use two finger gestures to zoom and pan. To pass this gesture to the underlying page, set enableTwoFingerZoom: false.
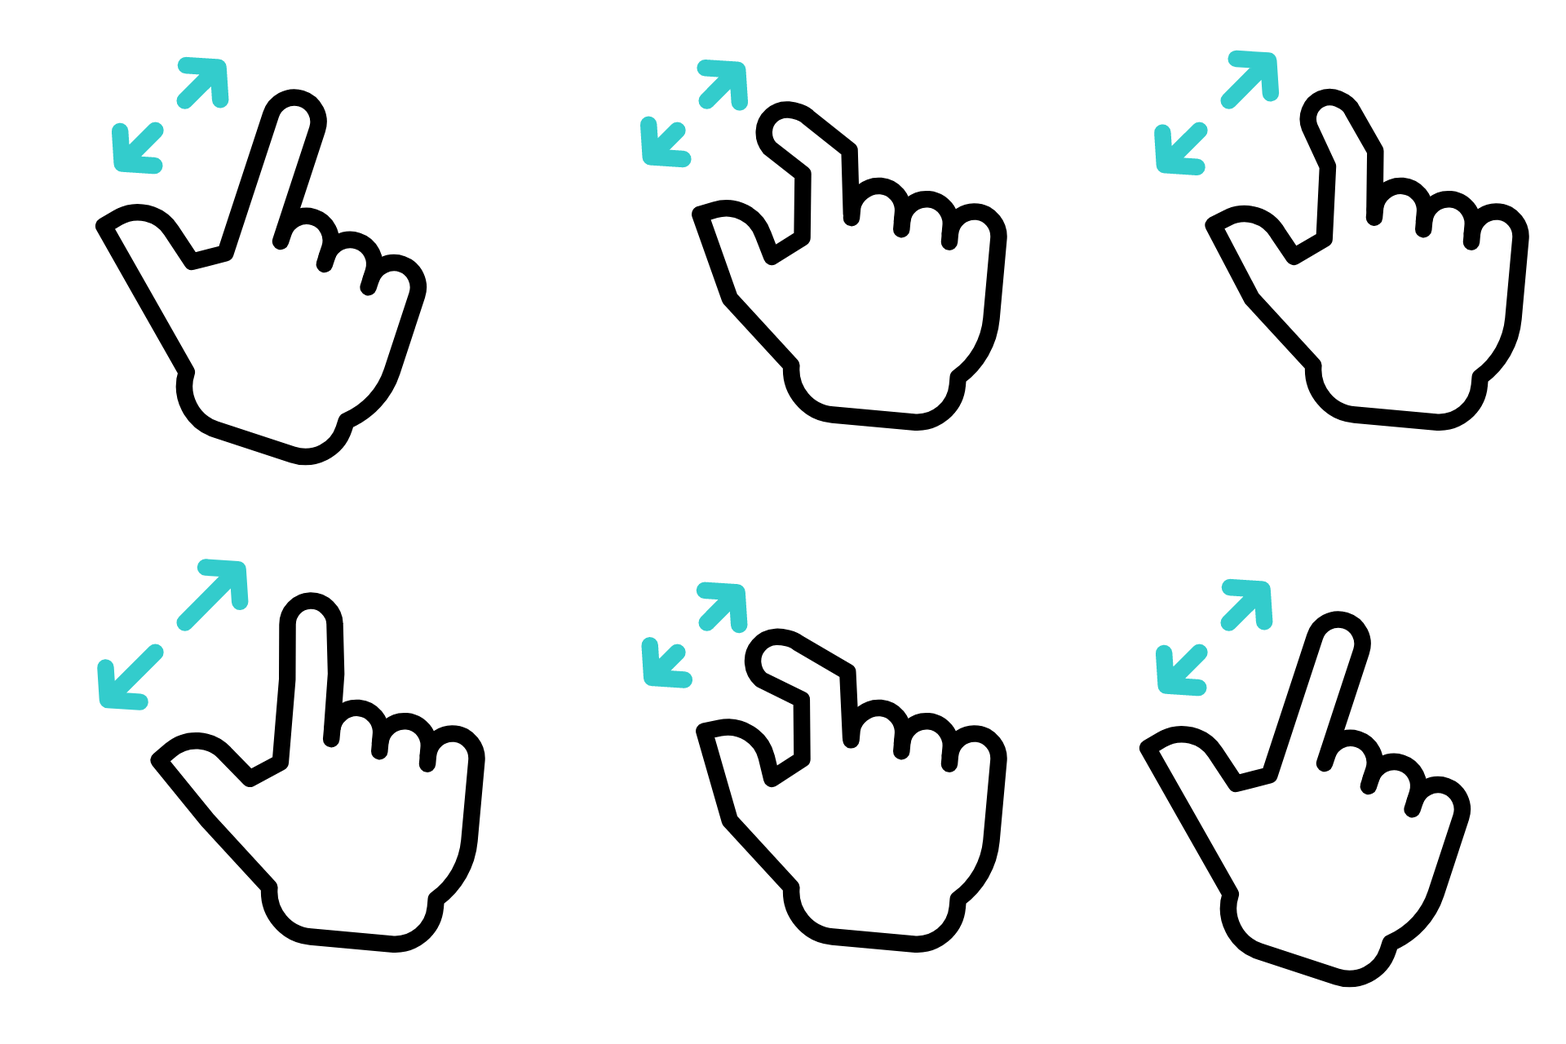
Two Finger Zoom
Pinch with two fingers to zoom in and out.
import { createApp, defineComponent, ref } from "vue";
import { AgCharts } from "ag-charts-vue3";
import type { AgChartOptions } from "ag-charts-types";
import {
  AnimationModule,
  ContextMenuModule,
  CrosshairModule,
  LegendModule,
  LineSeriesModule,
  ModuleRegistry,
  NumberAxisModule,
  ZoomModule,
} from "ag-charts-enterprise";
import { getData } from "./data";
import clone from "clone";

ModuleRegistry.registerModules([
  AnimationModule,
  CrosshairModule,
  LegendModule,
  LineSeriesModule,
  NumberAxisModule,
  ZoomModule,
  ContextMenuModule,
]);

const ChartExample = defineComponent({
  template: `
    <div class="example-controls">
      <div class="controls-row">
        <span>Two Finger Zoom:</span>
        <div class="button-group" role="group" aria-label="Two Finger Zoom">
          <input type="radio" id="two-finger-zoom-enabled" name="two-finger-zoom" value="true" checked="" v-on:change="toggleTwoFingerZoom($event)">
            <label for="two-finger-zoom-enabled">Enabled</label>
            <input type="radio" id="two-finger-zoom-disabled" name="two-finger-zoom" value="false" v-on:change="toggleTwoFingerZoom($event)">
              <label for="two-finger-zoom-disabled">Disabled</label>
            </div>
          </div>
        </div>
        <ag-charts
          :options="options"
        />
  `,
  components: {
    "ag-charts": AgCharts,
  },
  setup(props) {
    const options = ref<AgCartesianChartOptions>({
      animation: { enabled: false },
      touch: {
        dragAction: "none",
      },
      zoom: {
        enableDoubleClickToReset: false,
        enableTwoFingerZoom: true,
      },
      initialState: {
        zoom: {
          ratioX: { start: 0.48, end: 0.52 },
          ratioY: { start: 0.21, end: 0.82 },
        },
      },
      tooltip: {
        enabled: false,
      },
      axes: {
        y: {
          type: "number",
          interval: {
            minSpacing: 80,
            maxSpacing: 120,
          },
        },
        x: {
          type: "number",
          nice: false,
          interval: {
            minSpacing: 80,
            maxSpacing: 120,
          },
          label: {
            autoRotate: false,
          },
        },
      },
      data: getData(),
      series: [
        {
          type: "line",
          xKey: "year",
          yKey: "spending",
        },
      ],
    });

    const toggleTwoFingerZoom = (event) => {
      const optionsCopy = clone(options.value);

      const enabled = event.target.value === "true";
      if (optionsCopy.zoom) {
        optionsCopy.zoom.enableTwoFingerZoom = enabled;
      }

      options.value = optionsCopy;
    };

    return {
      options,
      toggleTwoFingerZoom,
    };
  },
});

createApp(ChartExample).mount("#app");
const NUM_DATA_POINTS = 400;

export function getData() {
  const data: Array<{ year: number; spending: number }> = [];
  for (let i = 0; i < NUM_DATA_POINTS; i++) {
    data.push({
      year: new Date().getFullYear() - NUM_DATA_POINTS + i,
      spending:
        i === 0 ? random() * 100 : data[i - 1].spending + random() * 10 - 5,
    });
  }
  return data;
}

let seed = 1234;
function random() {
  seed = (seed * 16807) % 2147483647;
  return (seed - 1) / 2147483646;
}
{
    zoom: {
        enableTwoFingerZoom: true | false,
    },
}
Long Tap Copy Link
Long Tapping the chart will open the Context Menu, if available.

Long Press
Hold to open the Context Menu on a chart.
import { createApp, defineComponent, ref } from "vue";
import { AgCharts } from "ag-charts-vue3";
import type { AgChartOptions } from "ag-charts-types";
import {
  AnimationModule,
  CategoryAxisModule,
  ContextMenuModule,
  CrosshairModule,
  LegendModule,
  LineSeriesModule,
  ModuleRegistry,
  NumberAxisModule,
} from "ag-charts-enterprise";

ModuleRegistry.registerModules([
  AnimationModule,
  CategoryAxisModule,
  CrosshairModule,
  LegendModule,
  LineSeriesModule,
  NumberAxisModule,
  ContextMenuModule,
]);

const ChartExample = defineComponent({
  template: `
    <div class="example-controls"></div>
    <ag-charts
      :options="options"
    />
  `,
  components: {
    "ag-charts": AgCharts,
  },
  setup(props) {
    const options = ref<AgCartesianChartOptions>({
      title: {
        text: "Financial Performance Overview",
      },
      animation: { enabled: false },
      data: [
        {
          year: 2018,
          revenue: 120,
          expenses: 80,
          profit: 40,
          investments: 30,
          taxes: 20,
          dividends: 10,
          rAndD: 25,
        },
        {
          year: 2019,
          revenue: 140,
          expenses: 90,
          profit: 50,
          investments: 40,
          taxes: 25,
          dividends: 12,
          rAndD: 30,
        },
        {
          year: 2020,
          revenue: 160,
          expenses: 100,
          profit: 60,
          investments: 50,
          taxes: 30,
          dividends: 15,
          rAndD: 35,
        },
        {
          year: 2021,
          revenue: 180,
          expenses: 110,
          profit: 70,
          investments: 55,
          taxes: 35,
          dividends: 18,
          rAndD: 40,
        },
        {
          year: 2022,
          revenue: 200,
          expenses: 120,
          profit: 80,
          investments: 60,
          taxes: 40,
          dividends: 20,
          rAndD: 45,
        },
      ],
      series: [
        { type: "line", xKey: "year", yKey: "revenue", yName: "Revenue" },
        { type: "line", xKey: "year", yKey: "expenses", yName: "Expenses" },
        { type: "line", xKey: "year", yKey: "profit", yName: "Profit" },
        {
          type: "line",
          xKey: "year",
          yKey: "investments",
          yName: "Investments",
        },
        { type: "line", xKey: "year", yKey: "taxes", yName: "Taxes" },
        { type: "line", xKey: "year", yKey: "dividends", yName: "Dividends" },
        { type: "line", xKey: "year", yKey: "rAndD", yName: "R&D Spending" },
      ],
    });

    return {
      options,
    };
  },
});

createApp(ChartExample).mount("#app");
API Reference Copy Link
Properties available on the AgTouchOptions interface.
- dragAction
'none' | 'drag' | 'hover'default: 'drag' - Sets the input handling behaviour for single-finger touch drag events. - `'none'` - ignores these events, typically causing the default page-scrolling behaviour. - `'hover'` - makes these behave like mouse hover events, showing tooltip and crosshairs. - `'drag'` - makes these behave like mouse drag events (moving while holding left-button).
Properties available on the AgTouchOptions interface.
- dragAction
'none' | 'drag' | 'hover'default: 'drag' - Sets the input handling behaviour for single-finger touch drag events. - `'none'` - ignores these events, typically causing the default page-scrolling behaviour. - `'hover'` - makes these behave like mouse hover events, showing tooltip and crosshairs. - `'drag'` - makes these behave like mouse drag events (moving while holding left-button).