This section shows how to export charts via the Chart Toolbar and Grid API.
Export Charts via Chart Toolbar Copy Link
Users can use the 'Download Chart' Chart Menu item to download the rendered chart in the browser.
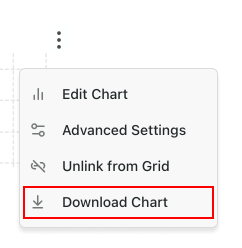
Note that the downloaded chart image will be in a PNG format.
Export Charts via Grid API Copy Link
There are two ways to download the chart image using the Grid API as shown below:
Returns a base64-encoded image data URL for the referenced chartId. |
Starts a browser-based image download for the referenced chartId. |
You can use the downloadChart(params) API to download the chart image in the browser.
Alternatively for programmatic use-cases, the getChartImageDataURL(params) API returns the chart image as string (base64 encoded); this is ideal for persisting to a back-end, or opening/presenting the chart image statically.
The example below demonstrates how you can retrieve images rendered from the chart in multiple formats.
- Click Download Chart Image (PNG) to download a PNG format image via
getChartImageDataURL() - Click Download Chart Image (JPG 800x500) to download a custom size image via
downloadChart() - Click Open Chart Image (JPG) to open a JPEG format image in a new window via
getChartImageDataURL()
import {
  createApp,
  defineComponent,
  onBeforeMount,
  ref,
  shallowRef,
} from "vue";
import { AgGridVue } from "ag-grid-vue3";
import "./styles.css";
import { AgChartsEnterpriseModule } from "ag-charts-enterprise";
import {
  AgChartThemeOverrides,
  CellSelectionOptions,
  ChartCreatedEvent,
  ClientSideRowModelModule,
  ColDef,
  ColGroupDef,
  CreateRangeChartParams,
  FirstDataRenderedEvent,
  GetChartImageDataUrlParams,
  GridApi,
  GridOptions,
  GridReadyEvent,
  ModuleRegistry,
  NumberEditorModule,
  NumberFilterModule,
  TextEditorModule,
  TextFilterModule,
  enableDevValidations,
} from "ag-grid-community";
import {
  ColumnMenuModule,
  ContextMenuModule,
  IntegratedChartsModule,
  RowGroupingModule,
} from "ag-grid-enterprise";
import { getData } from "./data";

if (process.env.NODE_ENV !== "production") {
  // Enable extended validations only for development
  enableDevValidations();
}

ModuleRegistry.registerModules([
  TextEditorModule,
  TextFilterModule,
  NumberEditorModule,
  NumberFilterModule,
  ClientSideRowModelModule,
  IntegratedChartsModule.with(AgChartsEnterpriseModule),
  ColumnMenuModule,
  ContextMenuModule,
  RowGroupingModule,
]);

let chartId: string | undefined;

const VueExample = defineComponent({
  template: `
        <div style="height: 100%">
                <div class="wrapper">
      <div id="buttons">
        <button v-on:click="downloadChartImage('image/png')">Download Chart Image (PNG)</button>
        <button v-on:click="downloadChart({ width: 800, height: 500 })">Download Chart Image (JPG 800x500)</button>
        <button v-on:click="openChartImage('image/jpeg')">Open Chart Image (JPG)</button>
      </div>
      <ag-grid-vue
        id="myGrid"
        style="width: 100%; height: 100%;"
        @grid-ready="onGridReady"
        :columnDefs="columnDefs"
        :defaultColDef="defaultColDef"
        :cellSelection="true"
        :popupParent="popupParent"
        :enableCharts="true"
        :chartThemeOverrides="chartThemeOverrides"
        :rowData="rowData"
        @first-data-rendered="onFirstDataRendered"
        @chart-created="onChartCreated"></ag-grid-vue>
        <div id="myChart" class="my-chart"></div>
      </div>
        </div>
    `,
  components: {
    "ag-grid-vue": AgGridVue,
  },
  setup(props) {
    const gridApi = shallowRef<GridApi | null>(null);
    const columnDefs = ref<ColDef[]>([
      { field: "country", chartDataType: "category" },
      { field: "sugar", chartDataType: "series" },
      { field: "fat", chartDataType: "series" },
      { field: "weight", chartDataType: "series" },
    ]);
    const defaultColDef = ref<ColDef>({
      editable: true,
      flex: 1,
      minWidth: 100,
      filter: true,
    });
    const popupParent = ref<HTMLElement | null>(document.body);
    const chartThemeOverrides = ref<AgChartThemeOverrides>({
      bar: {
        axes: {
          category: {
            label: {
              rotation: 335,
            },
          },
        },
      },
    });
    const rowData = ref<any[]>(null);

    function onFirstDataRendered(params: FirstDataRenderedEvent) {
      const createRangeChartParams: CreateRangeChartParams = {
        cellRange: {
          columns: ["country", "sugar", "fat", "weight"],
        },
        chartType: "groupedColumn",
        chartContainer: document.querySelector("#myChart") as any,
      };
      params.api.createRangeChart(createRangeChartParams);
    }
    function onChartCreated(event: ChartCreatedEvent) {
      chartId = event.chartId;
    }
    function downloadChart(dimensions: { width: number; height: number }) {
      if (!chartId) return;
      gridApi.value!.downloadChart({
        fileName: "resizedImage",
        fileFormat: "image/jpeg",
        chartId,
        dimensions,
      });
    }
    function downloadChartImage(fileFormat: string) {
      if (!chartId) return;
      const params: GetChartImageDataUrlParams = { fileFormat, chartId };
      const imageDataURL = gridApi.value!.getChartImageDataURL(params);
      if (imageDataURL) {
        const a = document.createElement("a");
        a.href = imageDataURL;
        a.download = "image";
        a.style.display = "none";
        document.body.appendChild(a);
        a.click();
        document.body.removeChild(a);
      }
    }
    function openChartImage(fileFormat: string) {
      if (!chartId) return;
      const params: GetChartImageDataUrlParams = { fileFormat, chartId };
      const imageDataURL = gridApi.value!.getChartImageDataURL(params);
      if (imageDataURL) {
        const image = new Image();
        image.src = imageDataURL;
        const w = window.open("")!;
        w.document.write(image.outerHTML);
        w.document.close();
      }
    }
    const onGridReady = (params: GridReadyEvent) => {
      gridApi.value = params.api;

      getData().then((rowData) => params.api.setGridOption("rowData", rowData));
    };

    return {
      gridApi,
      columnDefs,
      defaultColDef,
      popupParent,
      chartThemeOverrides,
      rowData,
      onGridReady,
      onFirstDataRendered,
      onChartCreated,
      downloadChart,
      downloadChartImage,
      openChartImage,
    };
  },
});

const app = createApp(VueExample);
app.mount("#app");
.wrapper {
    display: flex;
    flex-direction: column;
    height: 100%;
}

#myGrid {
    flex: 1;
}

.my-chart {
    flex: 1;
}

#buttons {
    padding-bottom: 10px;
}
export async function getData(delay: number = 100): Promise<any[]> {
    return new Promise((resolve) => setTimeout(() => resolve(generateData()), delay));
}

function generateData(): any[] {
    const countries = [
        'Ireland',
        'Spain',
        'United Kingdom',
        'France',
        'Germany',
        'Luxembourg',
        'Sweden',
        'Norway',
        'Italy',
        'Greece',
        'Iceland',
        'Portugal',
        'Malta',
        'Brazil',
        'Argentina',
        'Colombia',
        'Peru',
        'Venezuela',
        'Uruguay',
        'Belgium',
    ];

    return countries.map((country) => ({
        country,
        sugar: getRandomNumber(0, 50),
        fat: getRandomNumber(0, 100),
        weight: getRandomNumber(0, 200),
    }));
}

function getRandomNumber(min: number, max: number): number {
    return Math.floor(window.agRandom() * (max - min + 1)) + min;
}