




React Data Grid: Sparklines - Sparkline Data
This section starts off by comparing the different supported data formats before discussing how data can be formatted using a Value Getter for sparklines and then shows how data updates are handled.
Supported Data Formats
Sparklines are configured on a per-column basis and are supplied data based on their column configuration, just like any
other grid cell, i.e. columns are configured with a field attribute or Value Getter.
The data supplied to sparklines can be in the following formats:
In each of the formats above, Y values must be of type number, whereas X values can be a number, string, Date or
objects with a toString method, if they are provided.
It may be necessary to Format Sparkline Data using Value Getters if the data supplied to the grid is not in the correct format.
Array of Numbers
The simplest data format supported by the sparkline is the number[] format. This does not require any further
configuration, simply provide the array of numbers to the grid for that specific field.
Alternatively, a valueGetter can be added to return an array of numbers for each cell in the sparkline column.
- The numbers in the data array correspond to Y values.
- The X value for each data point will be the index of the value in the data array. For this reason, the data points will be evenly spaced out along the width of the sparkline.
This is demonstrated in the simple example below, where the 'Rate of Change' column contains the sparkline cell renderer.
- Note that the data for the
rateOfChangefield in the data.js file is anumber[].
Array of Tuples
Another supported format is the tuples array. In this format, each tuple in the array can contain two values, X and Y.
- At index 0 will be the X value and index 1, the Y value.
- The Y value should be a
numberwhereas the X can be anumber,string,Dateor an object with atoStringmethod. - The
rateOfChangefield is of type[Date, number][], where X values areDateobjects.
Array of Objects
The sparkline also supports an array of objects as a data format. This requires setting the xKey and yKey properties in
the sparklineOptions to the corresponding property names in the objects you’re providing, as shown in the code snippet below:
const rateOfChangeCellRendererParams = {
    sparklineOptions: {
        type: 'line',
        // set xKey and yKey to the keys which can be used to retrieve X and Y values from the supplied data
        xKey: 'xVal',
        yKey: 'yVal',
    }
};

<AgGridReact>
    <AgGridColumn field="rateOfChange" cellRenderer="agSparklineCellRenderer" cellRendererParams={rateOfChangeCellRendererParams} />
</AgGridReact>
Note in the example below:
- The data is an array of objects with the
xValandyValkeys. xKeyandyKeycan be anystringvalue as long as they are specified in the options.- By default, the
xKeyandyKeyare'x'and'y'respectively, so data objects with'x'and'y'keys would work fine without further configuration.
Formatting Sparkline Data
If the data is not already in the required format, it is possible to provide valueGetter in the column definitions to format and supply data to the sparkline column.
The formatted data from valueGetter will be supplied to the sparkline automatically by agSparklineCellRenderer.
The following example demonstrates how data can be formatted using valueGetter.
- In this example, the data for the
rateOfChangefield is an object withxandykeys, both containing an array of numbers. - A
valueGetteris used to format this data into[number, number][], entering the values for X and Y at each index in two arrays for therateOfChangeobject.
Missing Data Points
Data for certain items or time periods might be missing or corrupted, or in some cases, we might want to intentionally show the absence of a value. In these cases, sparklines support correct rendering of incomplete data.
Missing Y values
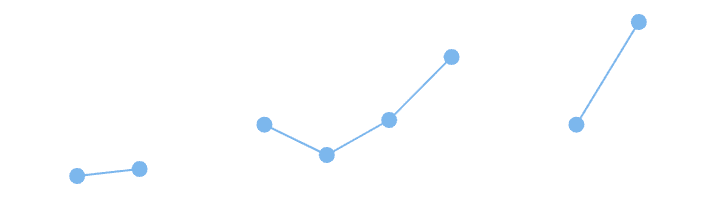
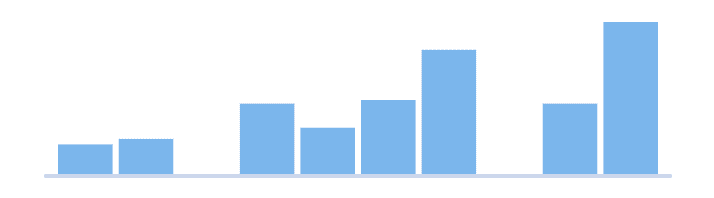
If the Y value of the data point is Infinity, null, undefined, NaN, a string or an object – basically if it's not a number – it will be classified as invalid.
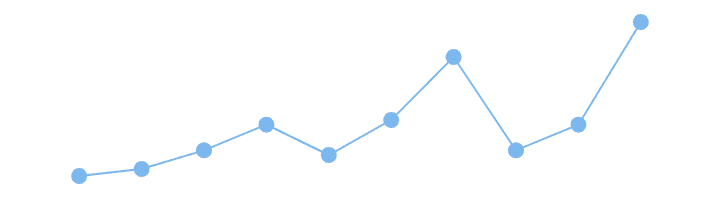
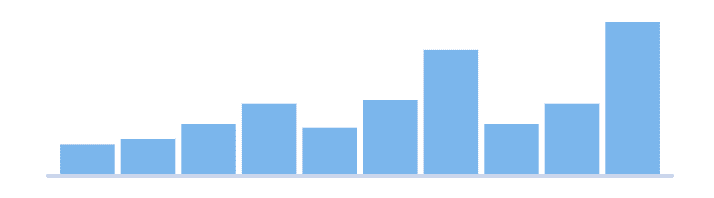
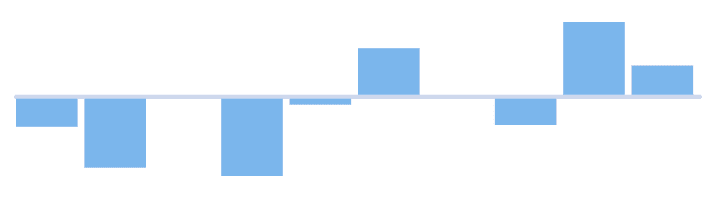
In the line and column sparklines, when a data point has an invalid Y value, it will be rendered as a gap, this is illustrated in the images below:
Line Sparkline
Column Sparkline
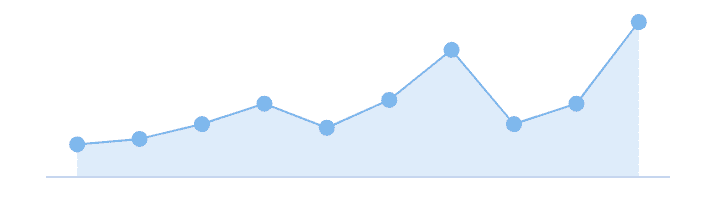
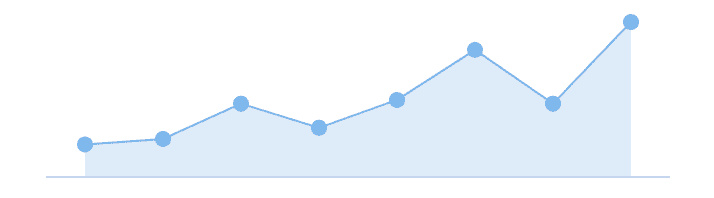
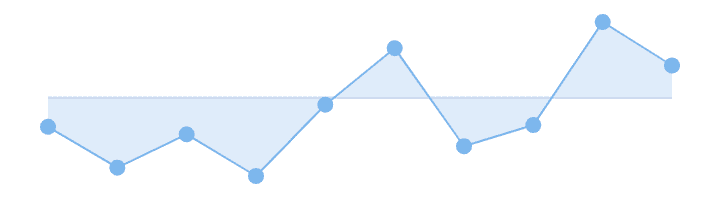
In the area sparklines, when a data point has an invalid Y value, it will be skipped in the sparklines. There won't be any gaps, only the valid data points will appear in the sparklines.
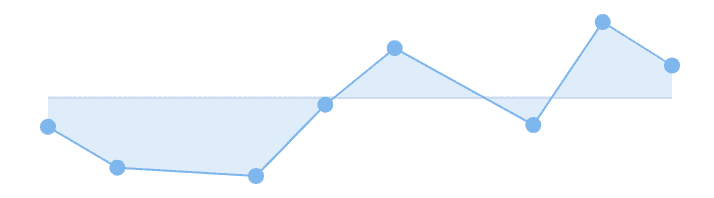
This can be seen in the images below where the area sparkline on the left has 10 valid data points, and the area sparkline on the right has only 8 valid data points.
Area Sparkline
Missing X values
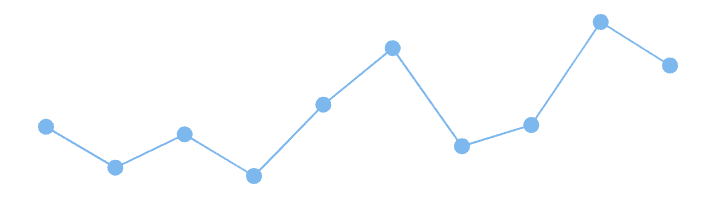
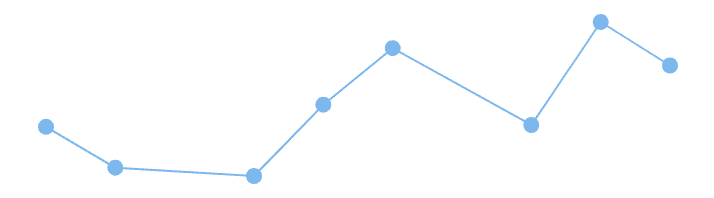
If X values are supplied in the sparkline data but are inconsistent with the configured x-axis type, they are considered invalid and will be skipped in the sparkline.
Let's say we have configured the x-axis to be a Number Axis, but some of the data points have X values which are not of type number.
In this case, those X values are invalid and so those data points will be ignored when the sparkline is rendered.
See the images below which show the line, column and area sparklines with 10 complete data points on the left, and on the right, with 8 valid X values and 2 invalid X values:

Updating Sparkline Data
Updating Sparkline data is no different from updating any other cell data, for more details see Updating Data.
The following example demonstrates Sparkline data updates using the Transaction Update API.
Next Up
Continue to the next section to learn about: Sparkline Axis Types.