



React Data GridChart CustomisationEnterprise
Chart themes can be used to customise the look and feel of your charts to match your application.
AG Charts support Chart Themes to change how charts are styled. There are a number of chart themes provided out of the box by the grid. You can also provide your own custom chart theme to the grid to customise the colours of charts along with other styling options. Alternatively, you can just provide overrides to tweak the provided chart themes in the way you want.
Provided Themes
There are five chart themes that are provided by the grid: 'ag-default', 'ag-material', 'ag-pastel', 'ag-vivid' and 'ag-solar'. When using a dark theme for the grid (e.g. ag-theme-alpine-dark), dark equivalents of the chart themes are provided by default instead, named with a -dark suffix, e.g. 'ag-vivid-dark'.
When you create a chart, you can scroll through the different available themes in the chart settings.
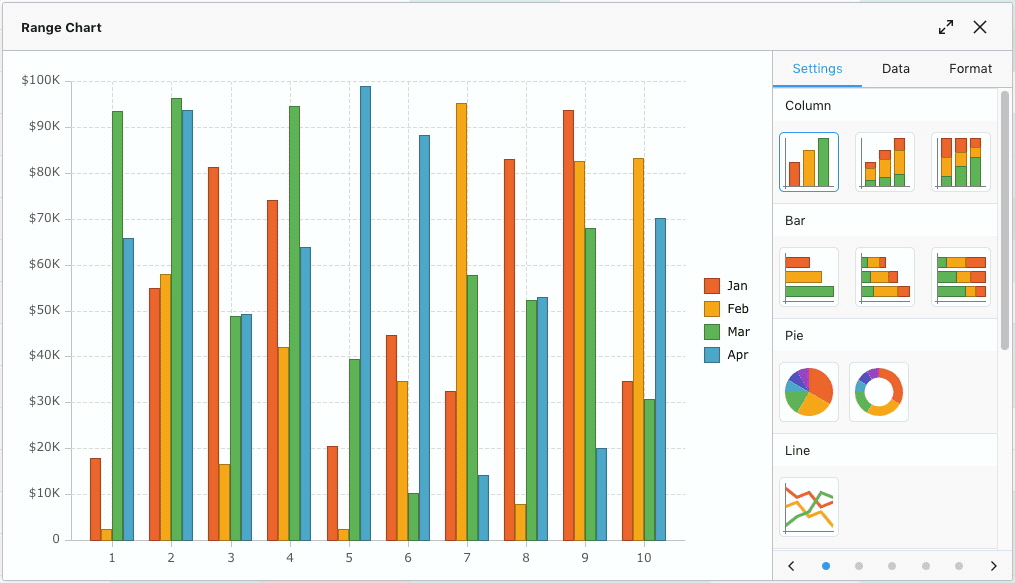
You can change which themes are available by setting the chartThemes property in gridOptions. The example below shows a different selection of themes configured in this way.
Custom Chart Themes
customChartThemes map on gridOptions. Your theme should then be specified in chartThemes to make it available to your users.
const customChartThemes = {
     myCustomTheme: {
         baseTheme: 'ag-pastel',
         palette: {
             fills: ['#c16068', '#a2bf8a', '#ebcc87'],
             strokes: ['#874349', '#718661', '#a48f5f']
         },
         overrides: {
             common: {
                 title: {
                     fontSize: 22,
                     fontFamily: 'Arial, sans-serif'
                 }
             }
         }
     }
 };

const chartThemes = ['myCustomTheme', 'ag-vivid'];

<AgGridReact
    customChartThemes={customChartThemes}
    chartThemes={chartThemes}
/>
The example below shows a custom chart theme being used with the grid. Note that other provided themes can be used alongside a custom theme, and are unaffected by the settings in the custom theme.
Overriding Existing Themes
Instead of providing a whole custom chart theme, you can simply use the chartsThemeOverrides grid option, which maps
to the overrides Theme property.
const chartThemeOverrides = {
    common: {
        title: {
            fontSize: 22,
            fontFamily: 'Arial, sans-serif'
        }
    }
};

<AgGridReact chartThemeOverrides={chartThemeOverrides} />
The following examples show different types of chart being customised using theme overrides.
Example: Common Chart Overrides
These overrides can be used with any chart type.
Example: Cartesian Chart Overrides
These overrides can be used with any cartesian chart.
Example: Line Chart Overrides
Example: Bar/Column Chart Overrides
Example: Area Chart Overrides
Example: Scatter/Bubble Chart Overrides
Example: Pie/Doughnut Chart Overrides
Example: Histogram Chart Overrides
Next Up
Continue to the next section to learn about: Chart Events.