



JavaScript Data GridSparklines - Points of InterestEnterprise
This section covers customisation of Sparkline Points of Interest.
Some data points in the sparklines are special and can be emphasised to allow for quick identification and comparisons across the values of a single sparkline or across multiple sparklines of the same type. These include:
- First and Last
- Minimum and Maximum
- Positive and Negative
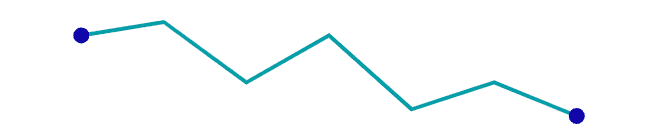
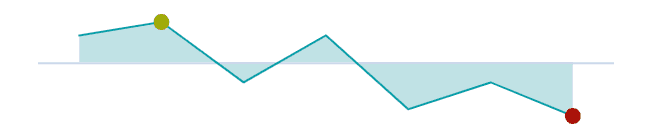
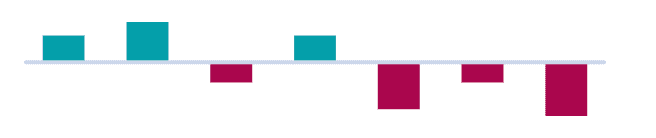
These special points can be customised via the formatter callback function to make them stand out from the rest of the data points which are using the global styles.
- The formatter is a callback function used to return formatting for individual data points based on the given parameters.
- The formatter receives an input parameter according to the sparkline type.
Below are some examples demonstrating the different formatters for the three sparkline types:
- Line and Area Sparklines Points of Interest
- Column and Bar Sparklines Points of Interest
- Full Example
Line and Area Sparklines Points of Interest
In the line and area sparklines, each data point is represented by a marker. To customise the points of interest, the formatter function is added to the marker options:
sparklineOptions: {
    marker: {
        formatter: markerFormatter, // add formatter to marker options
    },
}
The formatter callback function will receive an input parameter of type markerFormatterParams.
The function return type should be MarkerFormat, allowing the following attributes to be customised:
- size
- fill
- stroke
- strokeWidth
The following sections outline how the attributes mentioned above can be customised for various special points of interest:
First and Last
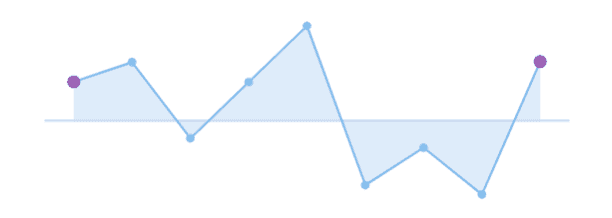
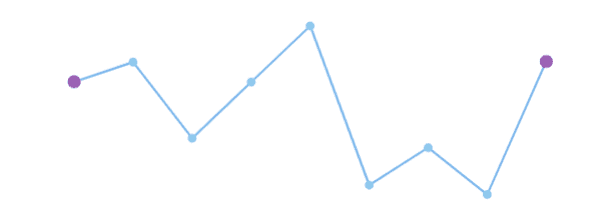
Let's say we have a line sparkline where the markers are all 'skyblue' but we want to make the first and last markers stand out with a purple fill and stroke style.
We can do this by adding the following formatter to the marker options.
const markerFormatter = (params) => {
    const { first, last } = params;

    return {
        size: first || last ? 5 : 3,
        fill: first || last ? '#9a60b4' : 'skyblue',
        stroke: first || last ? '#9a60b4' : 'skyblue'
    }
}- In the snippet above,
firstandlastboolean values are extracted from the params object and used to conditionally set thesize,fillandstrokeof the markers. - If the given data point is the first or last point i.e. if
firstorlastistrue, thesizeof the marker is set to5px. All other markers will be3px. - Similar conditional logic is applied to colorise the markers to distinguish the first and last points from the rest.
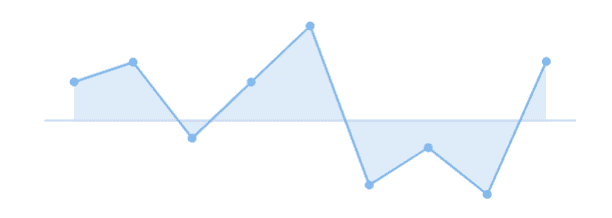
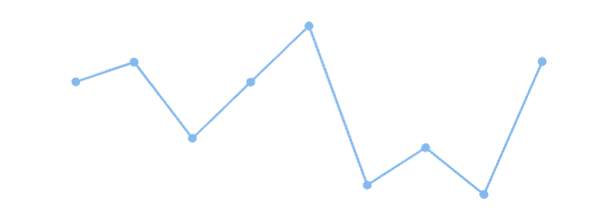
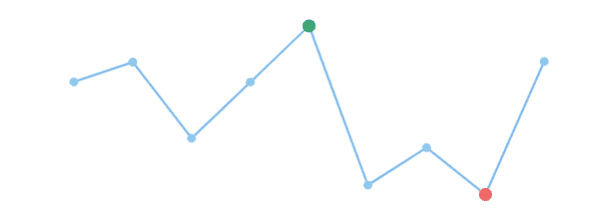
See the result of adding this formatter in the sparklines on the right below, compared with the ones on the left which are using global styles in marker options:
Min and Max
Similar to first and last, to emphasise the min and max data points, the min and max booleans from the formatter params can be used to conditionally style the markers.
const markerFormatter = (params) => {
    const { min, max } = params;

    return {
        size: min || max ? 5 : 3,
        fill: min ? '#ee6666' : max ? '#3ba272' : 'skyBlue',
        stroke: min ? '#ee6666' : max ? '#3ba272' : 'skyBlue',
    }
}- If the data point is a minimum or a maximum point – if
minormaxistrue– the size is set to5px, otherwise it is set to3px. - If the marker represents a minimum point, the
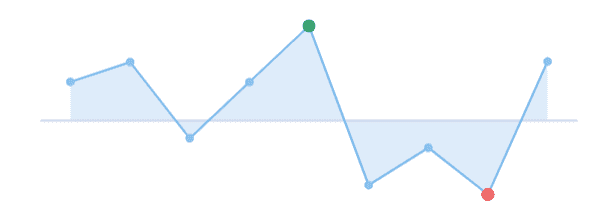
fillandstrokeare set to red, if the marker represents a maximum point, thefillandstrokeare set to green. Otherwise the fill and stroke are set to sky blue.
See the result of adding this formatter in the sparklines on the right below, compared with the ones on the left which are using global styles in marker options:
Positive and Negative
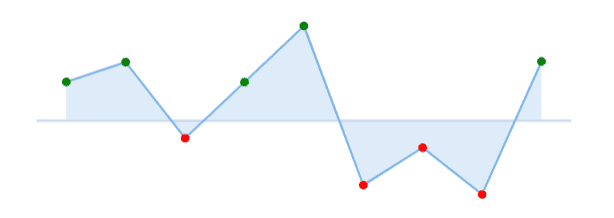
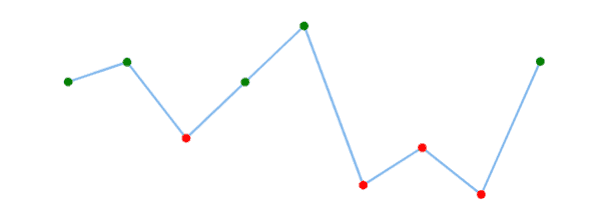
The positive and negative values can be distinguished by adding a formatter which returns styles based on the yValue of the data point.
This is demonstrated in the snippet below.
const markerFormatter = (params) => {
    const { yValue } = params;

    return {
        // if yValue is negative, the marker should be 'red', otherwise it should be 'green'
        fill: yValue < 0 ? 'red' : 'green',
        stroke: yValue < 0 ? 'red' : 'green'
    }
}
See the result of adding this formatter in the sparklines on the right below, compared with the ones on the left which are using global styles in marker options:
Column And Bar Sparklines Points of Interest
Bar sparklines are just transposed column sparklines and have the same configuration. This section only covers column sparkline examples but the same applies for bar sparklines.
In the column sparklines, each data point is represented by a rectangle/ column. The formatter callback function applies to the individual columns and is added to sparklineOptions:
sparklineOptions: {
    type: 'column',
    formatter: columnFormatter, // add formatter to sparklineOptions
}
The formatter will receive an input parameter with values associated with the data point it represents. The input parameter type is columnFormatterParams.
The function return type should be ColumnFormat, allowing these attributes to be customised:
- fill
- stroke
- strokeWidth
The following sections outline how the attributes mentioned above can be customised for various special points of interest:
First and Last
Let's say we want to make the first and last columns in our column sparklines stand out by styling them differently to the rest of the columns.
We can do this by adding the following formatter to the sparklineOptions.
const columnFormatter = (params) => {
    const { first, last } = params;

    return {
        fill: first || last ? '#ea7ccc' : 'skyblue',
        stroke: first || last ? '#ea7ccc' : 'skyblue'
    }
}
Here is the result of adding this formatter compared with setting global styles in sparklineOptions:


Min and Max
Similar to first and last, to emphasise the min and max data points, the min and max booleans from the formatter params can be used to conditionally style the markers.
const columnFormatter = (params) => {
    const { min, max } = params;

    return {
        fill: min ? '#ee6666' : max ? '#3ba272' : 'skyBlue',
        stroke: min ? '#ee6666' : max ? '#3ba272' : 'skyBlue',
    }
}
Here is the result of adding this formatter compared with setting global styles in sparklineOptions:

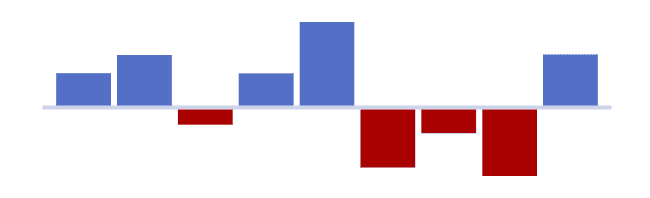
Positive and Negative
The positive and negative values can be distinguished by adding a formatter which returns styles based on the yValue of the data point.
This is demonstrated in the snippet below.
const columnFormatter = (params) => {
    const { yValue } = params;

    return {
        // if yValue is negative, the column should be dark red, otherwise it should be purple
        fill: yValue < 0 ? '#a90000' : '#5470c6',
        stroke: yValue < 0 ? '#a90000' : '#5470c6'
    }
}
Here is the result of adding this formatter compared with setting global styles in sparklineOptions:
Example: Points of Interest
The example below shows formatting of special points for line, area and column sparklines.
It should be noted that
- The
highlightedproperty on theparamsobject is used to distinguish between highlighted and un-highlighted states. - The
formatterfor line and area sparklines is added to themarkeroptions - The
sizeproperty is returned from the area and line formatters to make certain special markers visible and the rest invisible.
All formatters will receive the highlighted property in the input. If the current data point is highlighted, the highlighted property will be set to true; make sure to check this if you want to differentiate between the highlighted and un-highlighted states when customising the special points.
Interfaces
MarkerFormatterParams
Properties available on the MarkerFormatterParams interface.
MarkerFormat
Properties available on the MarkerFormat interface.
ColumnFormatterParams
Properties available on the ColumnFormatterParams interface.