



JavaScript ChartsLayout
This section explains the components of a chart and how they are laid out inside a chart.
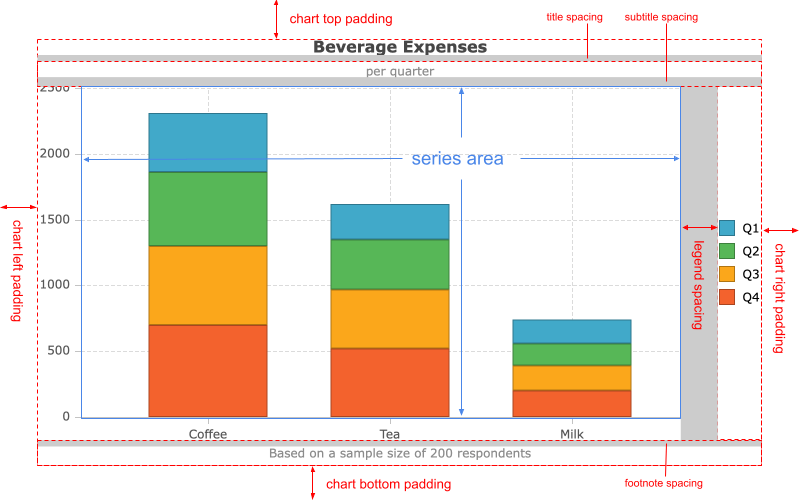
Each chart is composed of a single or multiple series, and optionally a legend, axes, and captions, such as title, subtitle and footnote. All of these components are managed by the chart's layout engine. They are sized and positioned appropriately based on the chart's dimensions, the nature of the data and the configuration.
Components are laid out in the following order; earlier elements take up space that is then unavailable for the layout of later elements:
- Chart padding
- Title plus its configured spacing
- Sub-title plus its configured spacing
- Footnote plus its configured spacing
- Legend plus its configured spacing
- Navigator plus its configured margin
- Series area padding
- Axes
- Series area
If any elements are hidden (not configured, or turned off explicitly or dynamically) then they do not consume any space during layout processing.
padding configuration is applied first, ensuring a clear boundary of all other components from the edge of the canvas.
Space is consumed on all sides of the available area based upon the padding configuration.
title configuration applies next, horizontally centring on the remaining space and consuming the
height of the title and its additional title.spacing.
subtitle configuration applies next, horizontally centring on the remaining space and consuming the
height of the title and its additional subtitle.spacing.
footnote configuration applies next, horizontally centring on the remaining space and consuming the height of the footnote and its additional footnote.spacing at the bottom.
legend configuration is applied to the remaining space. The exact space consumed depends on how the
legend is configured.
legend.spacing can be used to adjust the space between the legend and later components.
navigator configuration is applied next. The exact space consumed depends on how the
navigator is configured.
navigator.margin can be used to adjust the space between the navigator and later components.
seriesAreaPadding configuration is applied. It can be used to avoid the overlapping of series items with legend, title and axes labels.
axes layout is then calculated based upon the remaining space and how the axes are configured.
All remaining space is then dedicated to rendering of the configured series options.
When the chart size changes, the layout process is performed for the new available canvas space. Most components are typically a fixed size, so typically it is the series-area which shrinks or grows and most other components just move around or adjust alignment.
By default, the chart will resize automatically to fill the container element. If either the width or height configs are set, auto-sizing will be disabled unless the autoSize config is explicitly set to true.
Make sure to give the chart's container element an explicit size, otherwise you will run into a chicken and egg situation where the container expects to size itself according to the content and the chart expects to size itself according to the container.